


Absorption of infrared radiation brings about changes in molecular vibrations within molecules and ‘measurements’ of the ways in which bonds vibrate gives rise to infrared spectroscopy. Atom size, bond length and bond strength vary in molecules and so the frequency at which a particular bond absorbs infrared radiation will be different over a range of bonds and modes of vibration.
The different types of bonds
An organic molecule may contain quite a number of different bonds. All of these bonds will be vibrating, and clearly, different bonds will be vibrating at different frequencies.
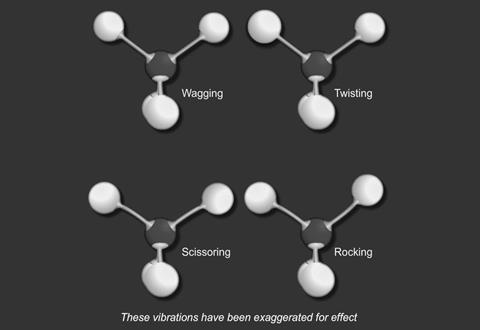
There are two basic modes of vibration:
- stretching
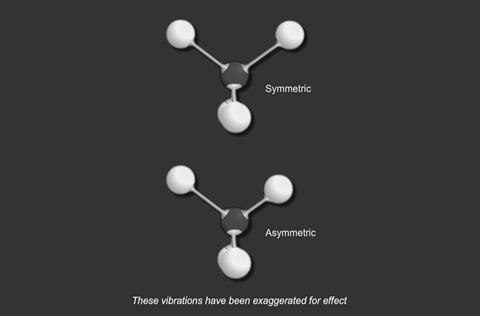
- and bending
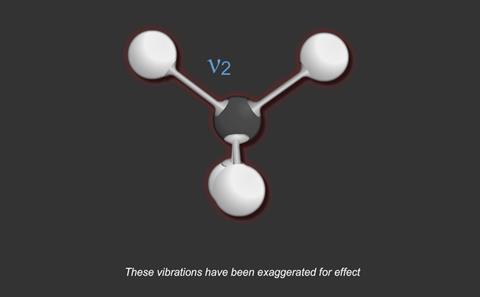
For a particular covalent bond in a molecule, only a particular set of vibrational frequencies is possible. Suppose a bond is vibrating at a frequency ν1 and its next available frequency is ν2; then, if radiation with a frequency (ν2 - ν1) is incident on the compound containing this bond, some of the radiation is absorbed and the bond vibrates at the higher frequency.
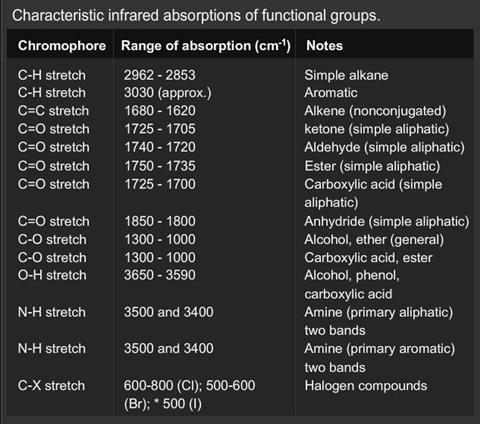
The frequency for a particular bond is more or less independent of other bonds in the compound; therefore, determination of the frequencies in the infrared region which are absorbed by a compound gives information about the types of bonds which are present.
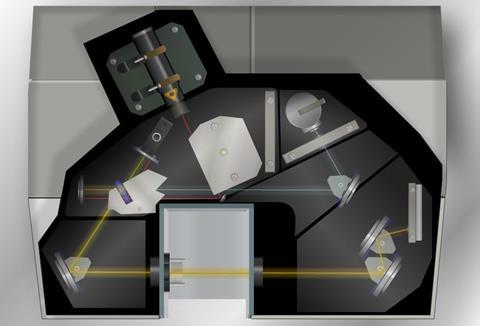
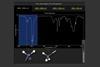
An infrared spectrometer analyses a compound by passing infrared radiation, over a range of different frequencies, through a sample and measuring the absorptions made by each type of bond in the compound. This produces a spectrum, normally a ‘plot’ of % transmittance against wavenumber.
No two organic compounds have the same infrared spectrum and so individual, pure compounds can be identified by examination of their spectra. In the region, 7–11 microns (1430–910 cm-1) there are many absorption bands and even pairs of almost identical organic molecules show up differences here. This region is known as the “fingerprint region” and provided that a chemist has a copy of the spectrum, any unknown pure compound can be identified by making a simple comparison.
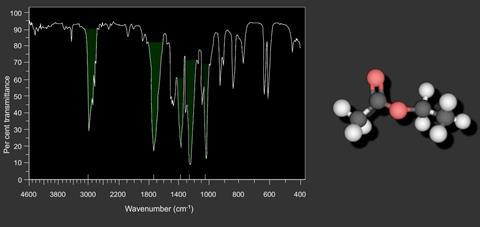
The region, 2.5–7 microns (4000–1430 cm-1) is simpler, and has less absorption bands. This region is used to aid the determination of structures because particular groups can be more easily identified. Bending frequencies tend to be rather numerous and complicated and are not used very much in identification. Stretching frequencies are much more useful and important groups can usually be identified with great certainty. The carbonyl group, for example, is a very strong chromophore, absorbing at approximately 1700 cm-1.
Downloads
Stretching vibrations
Simulation | Flash, Size 6.42 kbBending vibrations
Simulation | Flash, Size 10.68 kbVibrational frequencies
Simulation | Flash, Size 7.28 kbInfrared spectrometer
Simulation | Flash, Size 69.17 kbInteractive spectrum
Simulation | Flash, Size 77.19 kbInfrared stretching absorptions (A level)
Simulation | Flash, Size 0.44 mb
Infrared (IR) spectroscopy
- 1
 Currently reading
Introduction
- 2
- 3
- 4


10 readers' comments