


Use observing our environment and unexpected weather as contexts for teaching about seasonal changes
This resource is also available in Welsh and Irish

Get the Welsh language version.

Get the Irish language version.
Scientists observe and measure our climate and seasons in order to understand climate change. This topic web contains sustainability context ideas and classroom activity suggestions for teaching about seasonal changes to 4–7 year olds. Notice the changes in your environment in different seasons, or discuss and observe expected and unexpected weather in your area.
Each web explains the background science, describes how scientists are working in this field, and suggests ways to explore this in the classroom.
How to use this topic web
This resource is part of our Sustainability contexts for primary science teaching series. The series features a total of 20 topic webs designed to help you link your existing curriculum teaching to sustainability issues.
Find out more about how to use this topic web in your teaching.
-
Download this resource
Get both topic webs on seasons and unexpected weather for 4–7 years, with tips and suggested activities to use in the classroom.
Topic web 1: Observing seasonal changes
What’s the science?
The Earth is tilted on its axis. As we orbit the Sun over the course of a year, sometimes the northern hemisphere is closer to the Sun, sometimes the southern. This is what causes our seasons. When the seasons change, we experience different temperatures, weather, changes to plant life and animal behaviour. Global warming means that the Earth’s temperature is increasing, causing unexpected weather changes, like heavy rainfall or wildfires.
What are scientists doing about it?
A key part of the scientific method is observing over time. In the Antarctic, there are minimal influences from people and animals, so it’s the perfect place to measure changes to the Earth’s temperature. Scientists take the same measurements every day to look for patterns and anomalies (unusual data). Regular measurements have shown the surface temperature of the Earth is rising. This is climate change which is caused by human activity.
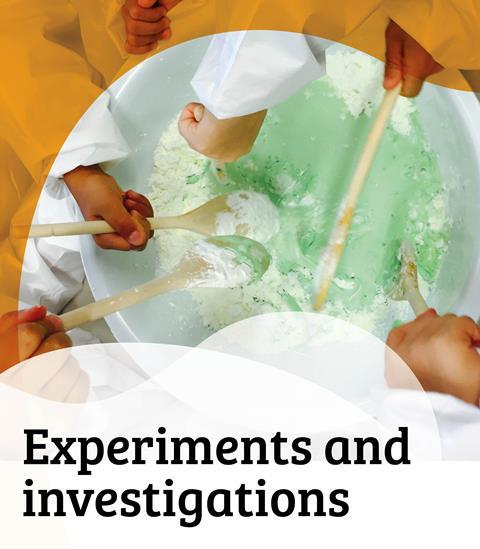
How could you explore this in the classroom?
- Do a ‘notice walk’ to observe the sky (is it sunny? cloudy? raining?), feel the temperature (is it warm? chilly? freezing?) and consider what you can hear (birds? wind in the trees?). Learners can write a stanza of a poem using “I see… I hear… I feel…”. Link to literacy by repeating the activity each term and reviewing the completed poems at the end of the year.
- Choose an area in or near the school where you can see some plants and sky. Take a photo or short video. Ask the learners to take the same image each week or month. Collate at the end of the year so they can observe the changes all together. What do they notice?
- Fill a metal tray with natural found objects and water, then freeze. Place the tray outside and time how long it takes to melt. Record the data in a table. Repeat each term. Learners could present the data in graphical format. Ask them how long it takes to melt in winter compared to summer? How do the leaves look different in autumn to spring? Make a season disk for each season and compare.
Curriculum links
Literacy; ICT; numeracy; observing over time; comparing, recording and handling data; seasonal changes; materials.
Topic web 2: Unexpected weather
What’s the science?
Climate change is being caused by increased pollution from human activity. The last seven years have recorded the hottest temperatures on record. This has upset the expected weather patterns in some regions, causing extreme floods, droughts, storms, heatwaves and fires. Floods are caused because the increased temperature in the atmosphere means the air can hold more water, but when it cools, the additional rainfall can cause flash floods.
What are scientists doing about it?
Atmospheric chemists analyse data on rainfall to spot patterns and present data in graphs. They use this information to raise awareness of the problems being caused by climate change and predict what could happen to our weather in the coming years. Activists like Greta Thunberg encourage governments to take action to reduce pollution to help slow the warming of the Earth.
How could you explore this in the classroom?
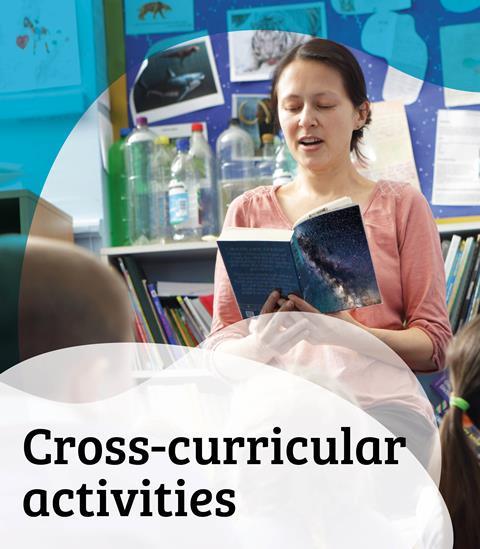
- Establish with the learners what expected weather looks like in your area that term. Then discuss what would be considered as unexpected. They could present their ideas on a mindmap. (Nothing is out of bounds: flooding is unexpected, as are fish falling from the sky!) Learners could ask adults at home if they remember experiencing unexpected weather. Link to literacy by asking learners to write up what they have discovered.
- Use the Katie Morag story ‘An island home’ to explore geography links by comparing weather in different localities.
- Observe the weather outside and use numeracy skills to set up a wet-play tally to add to throughout the year. Do some months have more wet play than others? Was there a day in the summer where the school had an unexpected wet play? Has the winter been warmer than usual?
- Set up a rain water collection tank outside your classroom. This could simply be a reused water bottle with some measurements marked on the side. Ask the learners to inform you when the water reaches a certain level. Does it ever overflow? Is that expected or unexpected?
Curriculum links
Literacy; ICT; numeracy; observing over time; measuring and recording; seasonal changes.
Try these additional resources
- Try more sustainability topic webs to provide context for key topics in primary science, including habitats and materials for 4–7 year olds.
- Browse the Primary Science Teaching Trust’s provision maps for teaching early years (age 3–5 years), including maps for spring, summer, autumn and winter.
Downloads
Seasons and unexpected weather | 4–7 years
PDF, Size 0.11 mb
Sustainability contexts for primary science
Find out how to teach science curriculum topics through engaging sustainability contexts. Our topic webs include suggestions for classroom activities that develop numeracy, literacy and scientific skills.
- 1
- 2
- 3
 Currently
reading
Currently
reading
Seasons and unexpected weather | 4–7 years
- 5
- 6
- 7
- 8
- 9
- 10
- 11


No comments yet