


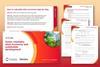
Introduce the concept of pH and address common misconceptions regarding the use of indicators
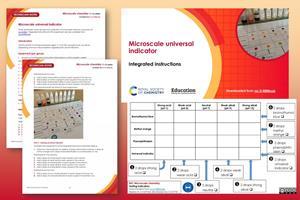
This microscale practical involves mixing chemicals in small drops and observing the colour changes of different indicators at specific pHs.
Following integrated instructions, learners will observe the colour changes of different indicators with a range of substances. Read our article on How to make teaching of acids, bases and indicators accessible to all learners.
Download this
All the information you need to prepare, set up and run this experiment with your learners:
- Technician notes as pdf and MS Word
- Integrated instructions as pdf and MS PowerPoint
- Integrated instructions (Welsh) as pdf and MS PowerPoint
Learning objectives
- Observe the colour changes associated with specific pHs using a range of indicators.
- Explain why we need a range of indicators to test pHs.
Equipment (per group)
- A4 print out of integrated instructions (laminated or within a plastic wallet)
All chemicals below to be supplied in 10 ml dropper bottles:
- Hydrochloric acid (0.1 mol dm-3), 12 drops
- Sodium hydroxide (0.1 mol dm-3), 12 drops
- pH 4 buffer solution, 12 drops
- pH 7 buffer solution, 12 drops
- pH 9 buffer solution, 12 drops
- Bromothymol blue solution (<1%), 20 drops (WARNING: flammable)
- Phenolphthalein (0.05%), 15 drops (WARNING: flammable)
- Methyl orange solution (<1%), 15 drops (WARNING: flammable)
- Universal indicator solution, 20 drops (WARNING: flammable)
Full preparation information and hazard classification is given in the technician notes.
Safety equipment
- Eye protection: safety glasses to EN166 F
Health, safety and technical notes
- Read our standard health and safety guidance and carry out a risk assessment before running any live practical.
- If in doubt, contact your school health and safety advisor.
- Refer to SSERC/CLEAPSS hazcards and recipe sheets.
Read the technician notes for full safety information, preparation and disposal.
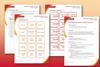
Method
Part 1 – testing indicators
Complete the experiment on the integrated instructions worksheet (slide 3).
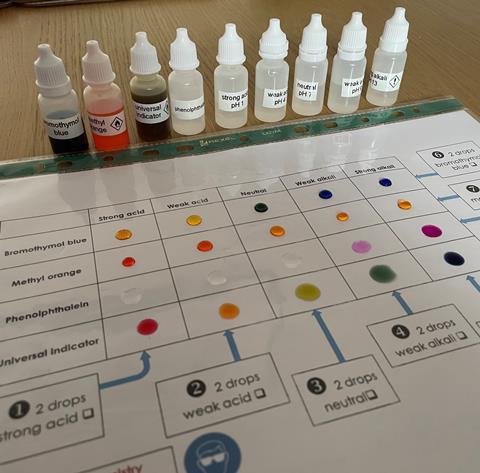
Working down the columns:
1. Add 2 drops of strong acid to each square in the first column.
2. Add 2 drops of weak acid to each square in the second column.
3. Add 2 drops of neutral buffer to each square in the third column.
4. Add 2 drops of weak alkali to each square in the fourth column.
5. Add 2 drops of strong alkali to each square in the last column.
Working across the rows:
6. Add 2 drops of bromothymol blue to each square in the top row.
7. Add 2 drops of methyl orange to each square in the second row.
8. Add 2 drops of phenolphthalein to each square in the third row.
9. Add 2 drops of universal indicator to each square in the bottom row.
More resources
- Use this worksheet with your 14–16 learners to explore the pH scale in the context of ocean acidification and link to UN sustainable development goal six.
- Find support and activities to tackle common misconceptions in Acids and bases: creating solutions.
- Understand how simulations can help improve students’ understanding of abstract concepts and explore the basics of pH using this PhET simulation.
- Add this quick, fun demonstration Creating an effercescent universal indicator rainbow to your lesson.
- Find out how Beth uses indicators to monitor water quality in her role as a chemistry engineer.
Part 2 – making universal indicator
Complete the experiment on the integrated instructions worksheet (slide 4).
1. Make the mixed indicator by adding 10 drops of bromothymol blue, 5 drops of methyl orange and 5 drops of phenolphthalein to a small beaker or vial.
Working down the columns:
2. Add 2 drops of strong acid to each square in the column.
3. Add 2 drops of weak acid to each square in the column.
4. Add 2 drops of neutral buffer to each square in the column.
5. Add 2 drops of weak alkali to each square in the column.
6. Add 2 drops of strong alkali to each square in the column.
Working across the rows:
7. Add 2 drops of your mixed indicator to each square in the top row.
8. Add 2 drops of universal indicator to each square in the bottom row.
Disposal
- Wipe down the laminated sheet/plastic wallet with a paper towel and dispose of the towel in laboratory waste.
- Rinse and dry the laminated sheet/plastic wallet.
Downloads
Microscale universal indicator technician notes
Handout | PDF, Size 0.35 mbMicroscale universal indicator integrated instructions
Handout | PDF, Size 0.52 mbMicroscale universal indicator integrated instructions Welsh
Handout | PDF, Size 0.51 mbMicroscale universal indicator technician notes
Editable handout | Word, Size 1.16 mbMicroscale universal indicator integrated instructions
Editable handout | PowerPoint, Size 0.68 mbMicroscale universal indicator integrated instructions Welsh
Editable handout | PowerPoint, Size 0.68 mb
Additional information
This resource is based on a method developed by CLEAPSS, PP057 Making a universal indicator – a microscale approach, available from the CLEAPSS science website.
No comments yet