


A new app analyses smartphone photos of TLC plates to calculate chemical concentrations

In your class
Download a one-slide summary of this article for use in your classroom (MS Powerpoint or pdf).
A new web app uses smartphone photos to convert thin-layer chromatography (TLC) into a quantitative analytical technique.
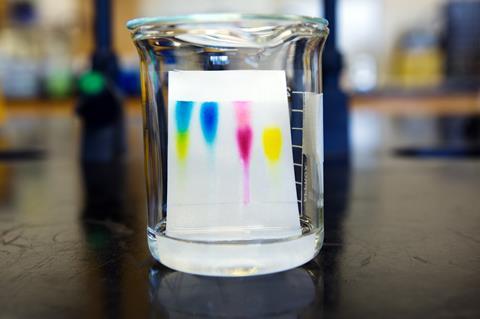
TLC separates compound mixtures on a sheet covered with an adsorbent material through the action of a solvent – in common classroom examples it is used to separate the components in black ink or leaf extracts. But until now, TLC has been limited to qualitative analyses – it can show how many different compounds a mixture contains, but not how much of each component there is.
Users of the new app need to place three samples of known concentration next to one of unknown concentration on their TLC plate and run it. When a photograph of the TLC plate is then uploaded to the app, it compares the size and intensity of the spots to estimate the concentration of compounds in the unknown sample.
Read the full story in Chemistry World.
Downloads
Starter slide - TLC app
PowerPoint, Size 0.18 mbStarter slide - TLC app
PDF, Size 0.31 mb


No comments yet