


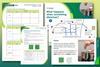
Ideas and strategies to help your students get to grips with graphs when exploring reaction dynamics and mechanisms
Rates of reaction covers a broad range of practical, mathematical and conceptual ideas. You can open a window into the sub-microscopic world of reaction kinetics, mechanisms and energetics by applying experimental and empirical data obtained from rate of reaction experiments. This article explores how you can use graphical representations with your students to interrogate reaction dynamics and mechanisms.
The applications of reaction kinetics are critical in many areas. Students will be familiar with the Haber process and how the manipulation of factors can optimise yields. These play a key role in food technology and the making of chemicals and pharmaceuticals. Food producers require accurate information about the rates that foods deteriorate and the way factors such as levels of oxygen, microbes, light and temperature affect these reactions. Furthermore, understanding the timing for drugs to be absorbed into our body and the time for elimination is critical.
Download this
A checklist containing more detail on controlling variables and representing them graphically, the power series and the rate determining step as MS Word or pdf.
A checklist containing more detail on controlling variables and representing them graphically, the power series and the rate determining step from the Education in Chemistry website: rsc.li/xxxxxxx
What students need to know
To understand the importance of applying reaction kinetics to reveal potential reaction mechanism and energetics profiles, students should have a good grasp of:
- what constitutes a chemical reaction and how we measure and record the rate of a reaction;
- how to represent the changes in a reaction by applying graphical approaches;
- the chemical significance of the slope and intercept of a rate graph;
- the construction and use of straight-line graphs (y=mx+c).
Threshold concepts
Students’ confidence in understanding reaction kinetics requires a good understanding of controlling variables and representing them graphically (seeing how concentration of reactants influences the rate of a reaction); the power series and their manipulation; and the concept of a rate determining step. Download the checklist to get more detail on these concepts and how to present them to students.
Misconceptions
Often misconceptions that students develop earlier in their secondary education (ages 11–16) significantly influence their understanding at post-16. These can include:
- If you can’t see it, it has disappeared or was never there.
- All reactants equally influence how fast a reaction proceeds.
- All reactions are driven by two reactants.
Ideas for your teaching
Providing students with real-world applications for reaction rates can be a powerful way to engage them. Choose examples carefully to provide students with interesting opportunities to apply their knowledge and to assess their own depth of understanding. You might need to simplify examples, as in the vitamin C loss box out below, but they still provide a realistic context in which students can apply their rates knowledge.
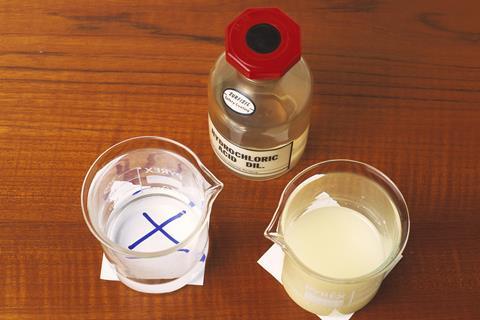
Students can investigate the rate at which vitamin C degrades in fruit juice by adapting the Global experiment: measuring vitamin C in food. Ask students to use the information from this resource to write a rate expression for vitamin C. You can extend the investigation by using a range of fruit juices and asking students to suggest a possible rate determining step.
Students can investigate the rate at which vitamin C degrades in fruit juice by adapting the Global experiment: measuring vitamin C in food (rsc.li/3pTUf8L). Ask students to use the information from this resource to write a rate expression for vitamin C. You can extend the investigation by using a range of fruit juices and asking students to suggest a possible rate determining step.
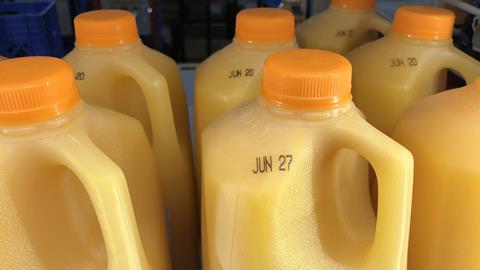
Vitamin C loss in fruit juices
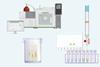
The most common cause of vitamin C degradation is oxidation. Research shows that this is a zero order process with respect to vitamin C and first order with respect to oxygen. Adding sugar displaces the oxygen and this reduces the rate of reaction.
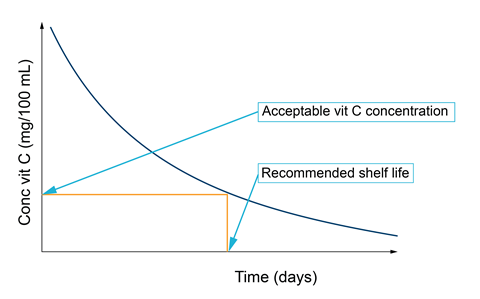
The amount of vitamin C (ascorbic acid) can be determined by titrimetric analysis using either a DCPiP or iodometric process. If the analysis of a sample is conducted over time, the shelf-life of a product can be estimated (Figure 1).
It has also been shown that reducing the storage temperature of products significantly reduces the rates of degradation. This can be easily explained by utilising the ideas of the Maxwell-Boltzmann distribution model and the Arrhenius equation.
Another real-world context is the time it takes for our bodies to absorb and eliminate drugs, which is critical for much drug development and research. You can use alcohol as an example to investigate this rate of reaction. Students can sketch graphs for the rate versus concentration for these processes. You can then ask them to write a rate equation.
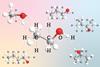
Alcohol metabolism rates in the body
Studies show that the absorption of alcohol across the stomach and intestinal wall into the blood stream is rapid. Measurements indicate that the diffusion process is first order (absorption is directly proportional to concentration). This is expected as diffusion is driven by the much higher intestinal-alcohol concentrations than blood-alcohol concentrations.
Ethanol is eliminated from the body by enzyme-controlled oxidation reactions in the liver. These reactions follow a zero order profile with respect to ethanol, yet a first order for the enzymes.
This means that whether you consume alcohol slowly or quickly, if you consume the same amount, you will become equally intoxicated!

Staying with real-world applications, you can link students’ rates of reaction knowledge with the ever-increasing need to develop antibiotics to fight infections caused by bacteria. For background reading, share the article, Antibiotics: solving an evolving problem, with students. Ask them to sketch graphs for first and zero order antibiotic–pathogen interactions and suggest possible mechanisms. Can they support their mechanism using a model? You can then ask them to write a possible rate equation for the interaction between the antibiotic and the pathogen. In small groups or as a class discussion, you can then ask students what other interactions or reactions might influence the rate determining step in these processes.
Staying with real-world applications, you can link students’ rates of reaction knowledge with the ever-increasing need to develop antibiotics to fight infections caused by bacteria. For background reading, share the article, Antibiotics: solving an evolving problem, with students (rsc.li/3gsPsIl). Ask them to sketch graphs for first and zero order antibiotic–pathogen interactions and suggest possible mechanisms. Can they support their mechanism using a model? You can then ask them to write a possible rate equation for the interaction between the antibiotic and the pathogen. In small groups or as a class discussion, you can then ask students what other interactions or reactions might influence the rate determining step in these processes.
Antibiotics and fighting infections
The rate at which an antibiotic molecule binds with a target pathogen can be conceptualised as A + T = AT (A = antibiotic, T = target). Most antibiotic interactions with pathogens are either zero or first order processes.
Some antibiotics need to be delivered over a range of time intervals, so coatings that degrade at different rates in the blood stream have been developed.
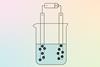
You could also introduce an investigation angle and ask students to investigate the effectiveness of different glues using a rates approach or the decomposition of hydrogen peroxide using different catalysts.
You might find some background reading useful to help your students build the foundations for their study of rates of reactions. There are helpful ideas for introducing the topic in the article, Rates of reactions; evidence-based teaching tips in 6 tips for teaching reaction rates using graphs, and an examination of teaching issues in Gradients and rates of change.
Video demonstrations can help students grasp some of the practical aspects of rates of reaction. The RSC has collated a selection of videos to that end; they cover monitoring the rate of reaction, identifying the effects of changing temperature and concentration, and using initial rate and continuous monitoring methods. To make the most of practical videos and ensure students learn from their viewing, try using some of the approaches, including flipped learning, outlined in this article.
You could introduce an investigation angle and ask students to investigate the effectiveness of different glues using a rates approach or the decomposition of hydrogen peroxide using different catalysts (rsc.li/3pU6VfP).
You might find some background reading useful to help your students build the foundations for their study of rates of reactions. There are helpful ideas for introducing the topic in the article, ’Rates of reactions’ (rsc.li/35l9r5e); evidence-based teaching tips in ’6 tips for teaching reaction rates using graphs’ (rsc.li/3ztG26H), and an examination of teaching issues in Gradients and rates of change (rsc.li/35uzNlb).
Video demonstrations can help students grasp some of the practical aspects of rates of reaction. The RSC has collated a selection of videos to that end (rsc.li/3iJYRfR); they cover monitoring the rate of reaction, identifying the effects of changing temperature and concentration, and using initial rate and continuous monitoring methods. To make the most of practical videos and ensure students learn from their viewing, try using some of the approaches, including flipped learning, outlined in the article, ‘Make the most of practical videos’ (rsc.li/3iIqCp7).
Assessment
Assessing understanding is always done best by observing how students apply their knowledge. The examples above provide students with challenging scenarios in which to apply their knowledge and understanding of rates. The RSC’s Starters for 10 on kinetics offers assessment activities on collision theory and sketching Maxwell–Boltzmann and the importance of Maxwell–Boltzmann. You’ll also find the Starters for 10: Advanced level 2 on kinetics useful for assessing the rate determining step, calculating reaction rate and determining the rate equation plus Arrenhius and rate.
Assessing understanding is always done best by observing how students apply their knowledge. The examples above provide students with challenging scenarios in which to apply their knowledge and understanding of rates. The RSC’s Starters for 10 on kinetics (rsc.li/35pgzh8) offers assessment activities on collision theory and sketching Maxwell–Boltzmann and the importance of Maxwell–Boltzmann. You’ll also find the Starters for 10: Advanced level 2 on kinetics (rsc.li/2SusoQi) useful for assessing the rate determining step; calculating reaction rate and determining the rate equation plus Arrenhius and rate.
Take-home points
- Use real-life examples of reaction rates to highlight the relevance of the topic and engage students. For example, understanding reaction mechanisms can optimise yields, thereby saving money, or enhance the efficacy of medication.
- Assess students’ understanding by looking at how they apply their knowledge to different questions and scenarios.
- Use demos and videos to cover the practical aspects of the topic with demos or videos.
Andy Markwick is a teacher educator, researcher and dissertation/research supervisor at University College London (IOE)
Downloads
Teaching rates of reaction post-16 Teacher checklist
Article | Word, Size 0.17 mbTeaching rates of reaction post-16 Teacher checklist
Article | PDF, Size 0.26 mb
No comments yet