


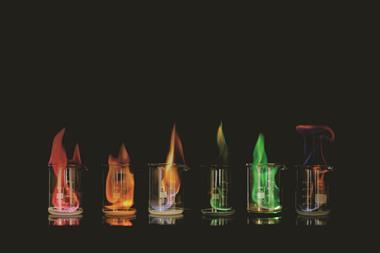
While much of chemistry can be explained to students using classical experiments, there’s no way to authentically visualise electrons transitioning between energy levels. Flame tests provide evidence through line spectra but this demonstration using LEDs offers an even simpler way to demonstrate this complex idea. The experiment is adapted from a classic physics A-level experiment.
Kit
- 3 V battery pack or power supply
- Potentiometer or rheostat
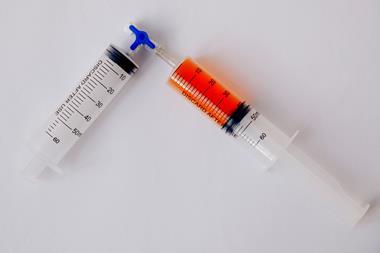
- Different coloured LEDs (use LEDs with clear housing so the colour obviously comes from the component)
- Voltmeter
- Ammeter or multimeter capable of reading in mA
- Wires and crocodile clips
- The LED requires a protecting resistor to keep the current below 20 mA. You may already have a Planck’s constant kit in school, or LEDs pre-mounted with resistors. If not, use another c.50 Ω resistor.
Preparation
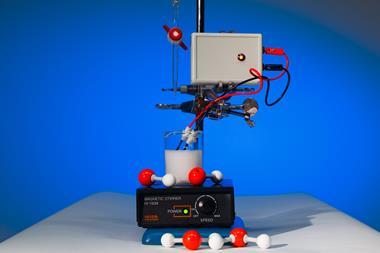
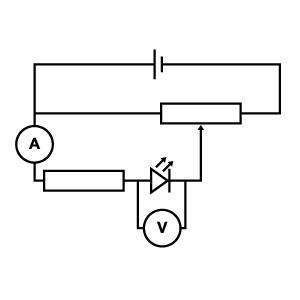
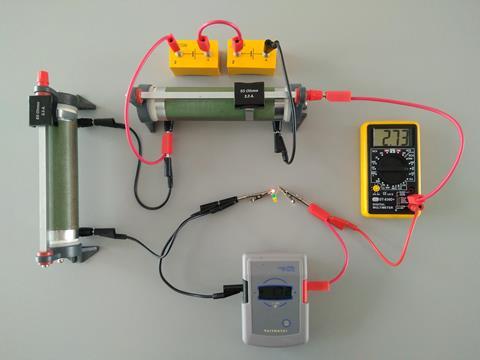
Setup the circuit (see figure 1) with a red LED, connecting the longer leg to the positive terminal. The potentiometer or rheostat controls the voltage through the LED; set this so the voltmeter reads 0 V. Then set the ammeter or multimeter to record current up to 20 mA – this is the typical maximum safe current for LEDs but it’s recommended to stay below 5 mA.
In front of the class
Remind students that electricity is the movement of charge, usually electrons in wires. The rate the electrons are flowing through the circuit is shown by the ammeter or multimeter. The voltmeter reading shows the energy per coulomb transferred by the electrons between the two points where it’s connected.
Within the LED there’s an energy barrier similar to the energy levels in atoms – an electron requires a minimum amount of energy to overcome it. As electrons cross the barrier, a photon of light is released of a frequency proportional to the size of the energy barrier. With this we can model atomic emissions (although the energy levels in the solid actually have a band structure).
Adjust the potentiometer or rheostat until the LED becomes visible to the students and note the voltage (probably around 1.6–1.7 V depending on lighting conditions in the room). Note too that the ammeter or multimeter will have just started to show current flowing (probably under 1 mA). Ask your students to suggest what will happen when the red LED is replaced for a green or blue one. The LEDs look identical but the green or blue LED won’t illuminate and the multimeter will probably show no current flowing.
With the same voltage passing through the green or blue LED as that used to light the red one, the electrons can’t cross the barrier, meaning no current flows and no light is released. If you use the potentiometer or rheostat to increase the voltage, each electron will receive more energy, allowing them to cross the barrier. This means the current can flow and the higher frequency LED will illuminate. This demonstrates that lower frequencies are associated with less energy, and that if the minimum energy criteria for the transition aren’t met, electrons can’t jump the energy barrier.
Once you’ve established the presence of the quantum jump needed for electrons to be able to pass through the diode, you can estimate the size of the energy barrier and the corresponding frequency of light.
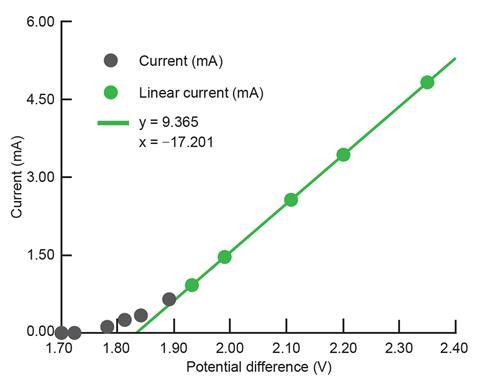
When the LED is lit, it’s above the ‘activation voltage’ associated with the minimum amount of energy needed to move electrons across the diode’s energy barrier. As you increase the voltage, the current increases proportionally (see figure 2) and the LED gets brighter as more and more electrons possess the necessary energy to make the jump. A spreadsheet is available to plot this data as you go.
Obviously we can’t see the photon associated with the jump of a single electron, but we can estimate the voltage at which that jump becomes possible by forecasting the linear part of the graph back to where that transition occurs at (almost) zero current (see figure 2).
The energy transferred by an electron is the product of its charge (1.67 x 10⁻¹⁹ C) and the potential difference across which it moves. The value from figure 2 gives 3.07 x 10⁻¹⁹ J, which students can convert to a wavelength of 647 nm (14% difference from the advertised 568 nm). Here the regression from multiple measurements reduces random errors but the value determined suffers from a systematic error resulting from the assumption the LED is 100% efficient.
Resources
- Spreadsheet for experiment: rsc.li/EiC317ec
- The classic physics experiment, measuring the Planck constant: bit.ly/2oEG9M8
Downloads
Spreadsheet
Excel, Size 63.79 kbTechnicians notes
PDF, Size 86.87 kbTechnicians notes
Word, Size 77.62 kb


No comments yet