

An icebreaker for thermodynamics
By  Declan Fleming2018-11-15T09:14:00
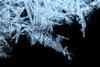
Your students can learn a lot of chemistry from watching water freeze
We take a look at some of the unexpected insights that changes of state can provide us with. This simple demonstration summarises many concepts that underpin the whole of chemistry.
Thanks for using Education in Chemistry. You can view one Education in Chemistry article per month as a visitor.
Register for Teach Chemistry for free, unlimited access
Registration is open to all teachers and technicians at secondary schools, colleges and teacher training institutions in the UK and Ireland.
Get all this, plus much more:
- unlimited access to resources, core practical videos and Education in Chemistry articles
- teacher well-being toolkit, personal development resources and online assessments
- applications for funding to support your lessons
Already a Teach Chemistry member? Sign in now.
Not eligible for Teach Chemistry? Sign up for a personal account instead, or you can also access all our resources with Royal Society of Chemistry membership.