


What constitutes ground-level air pollution and what are the impacts of such pollutants on Man and the environment? Air pollution data offer a tremendous resource for schools and colleges looking to enliven coursework.
- UK emissions of pollutants such as SO2, NOx and volatile organic compounds are decreasing, but in developing countries - where coal burning is a major source of energy - levels are rising

Air pollution, in the form of smoke, has been in existence throughout antiquity. The onset of the industrial revolution in the 17th century heralded a more lethal form of air pollution as man-induced emissions increased. In London, for example, episodes of stagnant smoke combined with dense fog became more frequent, causing severe health problems such as pulmonary disease and heart failure. More recently, in Los Angeles, US, in the late 1940s and early 1950s, a dense haze, later referred to as a photochemical smog, was observed. These smogs caused eye irritation, sore throats, asthma and other respiratory problems. Here we take a look the primary and secondary air pollutants responsible for these combustion and photochemical smogs.
Primary pollutants
Over the past century, the major primary pollutants in cities have been SO2, NOx (NO and NO2), CO, VOCs (volatile organic compounds such as alkanes, alkenes and ethers) and primary aerosols.
SO2
All fossil fuels (coal, oil and even gas) contain sulfur, which on combustion generates SO2 and a tiny fraction of SO3. Since the mid-1800s SO2 emissions have increased from 4 Mt in 1860 to the current level of ca 200 Mt. (The UK level is decreasing but the worldwide level is increasing owing to coal burning.) The amount of sulfur present in fossil fuels varies considerably: coal contains 0.1-4 per cent by mass of sulfur mainly as iron pyrites (FeS2), petrol - 0.04 per cent, diesel - up to 0.2 per cent, while natural gas contains as much as 40 per cent sulfur (as H2S). However, virtually all the sulfur can be removed from natural gas by passing through adsorbents. In coal-fired power plants, a major source of SO2, coal is separated from iron pyrites by adding surfactants and wetting agents (froth flotation) prior to burning. Any SO2 emerging with the flue gas can be removed by reaction with limestone to form hydrated calcium sulfate or gypsum. The main barrier to further reductions in sulfur emissions in burning coal is a financial one, though reduction in efficiency of the power station is also a consideration.
SO2 is relatively soluble and the human respiratory tract presents a large moist surface area to incoming air. About 95 per cent of the inhaled SO2 is thus absorbed here before reaching the lungs, and only ca 1 per cent reaches the alveoli, deep in the lungs. In the winter of 1952-53 in London, around 4000 deaths were attributed to combustion smogs. The combination of a strong temperature inversion - where the air near the ground is colder than the air above - which traps SO2, and the presence of high levels of soot and water vapour combined to make a lethal mixture. SO2 and water were adsorbed onto the soot particles and were catalysed by metals on the soot surface to form sulfuric acid. The sub-micron (μm) soot particles penetrated deep into the lungs where the adsorbed sulfuric acid damaged the cell surface and impaired oxygen transfer. Today in the UK domestic fuel is predominantly natural gas, which has a very low sulfur content, and vehicles produce little SO2.
In plants high levels of SO2 lead to the formation of sulfite and bisulfite ions, which cause cells to open more widely, leading to water loss and the entry of gaseous pollutants. SO2 also reacts with many materials, causing damage to stonework and steel structures for example.
NOx
NO and NO2, known collectively as NOx, are produced during combustion via the Zeldovitch mechanism:
O + N2 → NO + N (1)
N + O2 → NO + O (2)
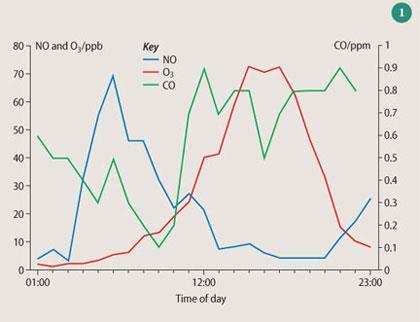
Reactions (1) and (2) are extremely endothermic and only occur at high temperatures. Around 50 per cent of NOx emissions are from vehicles, though burning coal is still an important source. Figure 1 shows that during weekdays, NOx concentrations have a typical diurnal cycle, following peak rush hours in the morning and the evening. Since the temperature of combustion is critical for NOx production, much effort has been expended in developing low-temperature industrial burners and engines that operate at a lower peak temperature. Catalytic converters, which catalyse the reduction of NO to N2 in exhaust gas emissions, have reduced significantly NOx emissions in cities. However, the steady increase in vehicle use suggests that NOx global emissions will rise markedly over the next century.
NO2 is less soluble than SO2 and can therefore penetrate deeper into the lung, causing respiratory damage. In plants NOx interferes with nitrite and nitrate reductase activity, leading to poor plant function.
CO and VOCs
Petrol engine vehicles are the main source of CO emissions. Catalytic converters catalyse the oxidation of CO to CO2 with 90 per cent efficiency. However, on a molecule per molecule basis, CO can combine with haemoglobin in the blood (to form carboxyhaemoglobin) some 200 times more efficiently than oxygen does. High levels of CO, 30 ppm for example, can cause headaches and impaired mental agility. CO is oxidised in the atmosphere, via reaction with the hydroxyl radical (.OH) to form CO2, with a lifetime of ca one month.
Myriad VOCs exist in city atmospheres, including alkanes, alkenes, alkynes, aromatics, halocarbons, carbonyls and alcohols. These VOCs are largely derived from vehicle emissions and solvent use, such as adhesives, aerosol propellants, printing, cleaning of metals and from paints. Industrial emissions of VOCs from the oil industry are another major source, while natural emissions from plants and trees also make a significant contribution to the urban and regional loading.
VOCs can be harmful to human health. For example, benzene and 1-3-butadiene are carcinogenic, while many aromatic compounds such as the polyaromatic hydrocarbons (PAH) are mutagens. VOCs are photooxidised in the atmosphere to form H2O and CO2, where the initiator is usually the hydroxyl radical, but the nitrate radical, .NO3, and indeed ozone, O3, can also be important oxidants. The lifetimes of VOCs vary enormously, from 10 years for methane, through months for ethane and weeks for ethyne, to a few hours for 1,3-butadiene. VOCs play a crucial role in the photochemical formation of ozone.
Primary aerosols
Man-induced activities also generate primary aerosols. Coal burning was the major source of black smoke or soot, but more recently, at least in cities, this falls to diesel vehicles. Grinding, drilling and crushing also release a range of particles into the atmosphere, while natural sources of primary aerosols include pollen, wind blown dust and soil erosion. However, the latter are minor sources compared with the man made ones in cities.
The impact of aerosol particles on human and animal health is directly related to their size and composition. Large particles, ie many tens of μm, are removed rapidly from the atmosphere by sedimentation and indeed particles whose diameters are larger than ca 10 μm are removed effectively in the nasal region in humans and do not penetrate further into the respiratory system.
However, aerosol particulate matter with a diameter of less than 10 μm (PM10) can penetrate deep into the lungs. Here, removal by direct impaction is slow and only very small particles, whose diameters are less than ca 0.1 μm, have Brownian diffusion velocities that are large enough for them to be lost to the walls of the trachea and bronchus. There is also a range of particles with diameters ca 0.1-1.0 μm, which can penetrate deep into the lungs and are therefore believed to be linked to respiratory illnesses such as asthma and bronchitis. Smoke particles are typically 1 μm or less in diameter and are therefore the dominant toxic aerosol in cities.
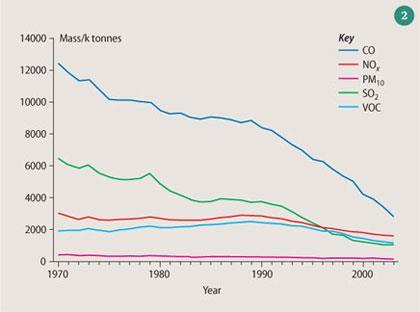
Table 1 summarises the main sources of primary pollutants, expressed as a percentage for each compound, together with the total estimated emissions for each compound in the UK in k tonnes for 2003. The trends in emissions of these primary pollutants from 1970-2003 are shown in Fig 2. (Data taken from the National Atmospheric Emission Inventory). It is clear that emissions of primary pollutants have been declining steadily over the past 30 years as cleaner combustion technology has been adopted in the UK.
Exposure to primary pollutants
While the highest levels of primary pollutants will be close to areas of high emissions, such as busy roads, there are other factors that can also influence the level of pollutants humans are exposed to - ie building geometry and wind speed and direction. The aspect ratio, R, of a street is defined as the height of the buildings in a street divided by the width of that street. As R increases so the street becomes narrower, and when R is greater than ca 0.7 the possibility of 'skimming flow' exists. If the wind speed exceeds ca 1.5 m s-1 and blows perpendicular to the street, ie across the top of the buildings from one side of the street to the other, a vortex will be set up that allows pollutants to be recirculated around the street and prevents them from escaping, see Fig 3.
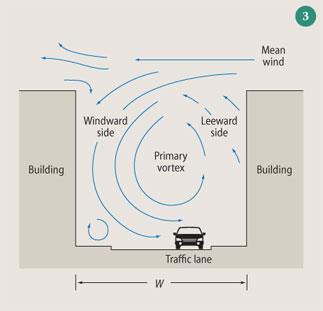
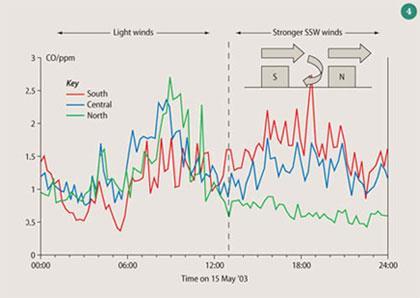
Figure 4 shows some measurements made at the Marylebone Road in London when the wind was blowing from the south side to the north side of the street at roof level. A vortex was created that blew pollutants from the north side to the south side of the street at ground level. During the early part of the day the wind was light and no vortex was formed, levels of pollutants were similar on both sides of the street, but as the wind picked up so the pollutant levels at the south side rose dramatically, while that on the north side decreased, so much so that the south side was at times experiencing five times the levels of pollution compared with the north side simply because of the building geometry, wind speed and direction.
Wind speed alone is an important factor for exposure to airborne pollutants. Under low wind speed conditions (less than 1 ms-1) pollutants stagnate at street level and thus levels can build up. Conversely at high wind speeds the major primary pollutants except PM10 are flushed out of the street and exposure tends to be low. At high wind speeds, road dust can be re-suspended, giving rise to elevated levels of particles. Thus PM10 exposure is a minimum at intermediate wind speeds (ca 4 ms-1).
Secondary pollutants
Once emitted into the atmosphere, primary pollutants can undergo photochemical oxidation, ie initiated by free radicals which are generated by sunlight. Secondary pollutants are formed, of which ozone (O3) and some secondary aerosols are believed to be the most detrimental to health.
Ozone
Once released into the atmosphere, NO and NO2 are rapidly inter-converted via reaction with ozone already present in the atmosphere, and photolysis of NO2:
NO + O3 → NO2 + O2 (3)
NO2 + hv → NO + .O(3P) (4)
wavelength ~ 400 nm
.O(3P) + O2 + M → O3 + M (5)
Under typical conditions in cities, reactions (3)-(5) are rapid and levels of these pollutants stabilise quickly if they are the only ones present. In a photochemical smog, however, when vehicle NOx emissions are predominantly NO, the following reaction occurs without destroying ozone:
NO + NO + O2 + M → 2NO2 + M (6)
However, reaction (6) is slow and only important at extremely high NO levels, ie close to the tail pipes of vehicles. The major reaction for converting NO to NO2 involves the hydroperoxy radical (.HO2) and organic peroxy radicals (termed .RO2), ie:
NO + .HO2 → NO2 + .OH (7)
NO + .RO2 → NO2 + .RO (8)
.RO + O2 → .HO2 + R-HO (9)
Reaction (8) produces an alkoxy radical (.RO) which reacts with oxygen in the atmosphere to produce a hydroperoxy radical and a carbonyl compound. Subsequent photolysis of NO2 via reaction (4) and addition of .O(3 P) atoms to oxygen in reaction (5) leads to net production of ozone.
The photooxidation of VOCs provides the source of peroxy radicals (.RO2) but for simplicity CO is used as the most simple example of photooxidation initiated by the OH radical. First, .OH is generated by the photolysis of ozone to produce excited O atoms ie .O(1 D), which can then react with water to yield .OH:
O3 + hv → .O(1D) + O2 (10)
.O(1D) + H2O → .OH + .OH (11)
The .OH then reacts with CO to produce a hydrogen atom and carbon dioxide. The hydrogen atom instantly adds to molecular oxygen, giving a hydroperoxy radical (.HO2). Reaction (7) converts NO to NO2 and .HO2 to .OH. Reactions (4) and (5) follow, with the production of ozone:
.OH + CO → .H + CO2 (12)
.H + O2 + M → .HO2 + M (13)
NO + .HO2 → NO2 + .OH (7)
NO2 + hv → NO + .O(3P) (4)
.O(3P) + O2 + M → O3 + M (5)
Net: CO + 2O2 → CO2 + O3
Thus photochemical smog formation is driven by the presence of NOx, CO, VOCs and sunlight, and the spatial extent and severity of the smog will depend on the mix of all three, together with local weather conditions. Such episodes are thus restricted to periods of intense sunlight and are exacerbated by still conditions. In cities, NOx levels are usually very high, and ozone production is said to be NOx - saturated. At these high levels, NOx can itself retard ozone formation by the reaction of NO2 with the OH radical to form nitric acid:
.OH + NO2 + M → HNO3 + M (14)
Reaction (14) is a radical termination reaction, since HNO3 is removed by wet and dry deposition and is a sink for .OH. Thus the highest levels of O3 are usually found downwind of cities. Figure 1 represents real data from the NETCEN archive for the Bristol area.
The ratio of VOC/NOx is a critical parameter in determining the rate of ozone production, with a maximum production rate occurring at a ratio of around eight. Reducing photochemical smog formation is not a straightforward issue. One can attempt to reduce initial NOx levels, which will lead to lower total ozone production, but will mean that peak ozone is experienced closer to the city, and therefore greater exposure to people. Reducing VOC levels will move the ozone peak further away from the source, and typically further away from human exposure, but will not reduce the total ozone produced. Emissions of VOCs from natural sources (eg from plants and trees) can be very high in the summer months. If these natural emissions are added to the reactive 'plume' leaving a major city they can also prolong photochemical smog episodes and is a factor that is very hard to legislate for. During the high ozone episode in August 2003, natural emissions, in concert with NOx from human activity, were largely responsible for extremely high surface ozone observed just north of London.
At 200 ppb ozone is thought to damage cells at the surface of the bronchia and the alveoli in the lungs, leading to inflammation. A variety of studies suggests that effects of ozone exposure can be observed above a threshold of around 50 ppb. The debate continues whether ozone induces or exacerbates asthma, particularly in the young and old.
In plants, the effect of ozone is more readily observed, where brown spots appear on leaves. On entering the stomata, ozone reacts rapidly, producing hydrogen peroxide and free radicals, but does not penetrate far into the plant. Ozone, like SO2, reduces the rate of photosynthesis, and therefore can reduce crop yields.
Secondary organic aerosols (SOA)
Aerosol formation in the atmosphere can reduce visibility and affect climate and chemical processes. Secondary organic aerosols are formed via gas-to-particle conversion of either low volatility or highly soluble organic species. Since the formation of these precursors are often photochemically driven, it is common for secondary aerosol formation to accompany a photochemical smog.
During a photochemical smog, reduced organic compounds such as alkanes and alkenes are often oxidised to products of the same carbon number, but of a higher molecular weight. These products will include functional groups such as carboxylic acids, aldehydes, ketones, alcohols, and nitrates. All of these functional groups tend to reduce the volatility of the compound relative to its precursor and can increase the atmospheric loading of sub-micron particles.
The new GCSEs include sections on air quality and climate change. The air quality data archive (NETCEN) and the National Atmospheric Emissions Inventory are excellent resources for looking at trends in pollutants over the years and differences in emissions geographically.
Dudley Shallcross is a reader in the school of chemistry at the University of Bristol, Cantock's Close, Bristol BS8 1TS.
Acknowledgements
I thank Drs Damien Martin, Graham Nickless and Carl Percival for their comments on this article and the DAPPLE consortium for allowing data to be used.
Related Links
Health effects and air pollution
A report from a group of Edinburgh University medical students
Smog
Art exhibition on smog
DAPPLE
The Dispersion of Air Pollutants and their Penetration into the Local Environment project, London 2003-04
National Atmospheric Emissions Inventory
Catalogues all estimates of emission sources for each major pollutant in the UK


No comments yet