


Commercial sunscreens provide the basis of an industry-linked investigation suitable for students at various levels.1 The experiments highlight the pivotal role of uv absorption spectra, photoisomerisation, the Beer-Lambert law and molar absorption coefficients in such products.
-
Students discover how organic sunscreens work
-
Students use sun protection factors (SPF) and 'star rating' numbers to design their own online formulations
Excessive exposure to the Sun's uv radiation causes sunburn, ageing and skin cancers.2 The different types of uv radiation - UVA, UVB and UVC - characterised by the different wavelengths, however, have distinctive biological effects (see Table 1). Most commercial, topical sunscreens bought in Europe protect our skin from UVB and UVA radiation. The 'SPF' or sun protection factor, a number on the front of the bottles containing these products, provides information about protection, mainly from UVB radiation. Some sunscreens also carry information on the product's UVA protecting properties. For example, the Boots' zero to five 'star rating' in the UK provides information about the ability of the product to block UVA in relation to UVB radiation - a five-star rating indicates that nearly as much UVA is blocked as is UVB for that product.
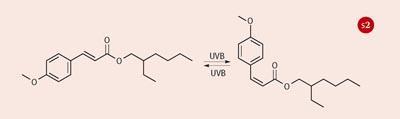
Organic sunscreens function in variety of ways, but all are designed to be photostable uv absorbers that dissipate the absorbed energy rapidly and harmlessly as heat.3
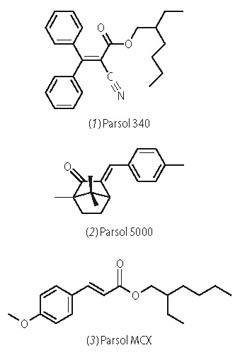
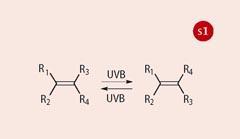
The commercial sunscreens used in this practical - Parsol 340 (1), Parsol 5000 (2) and Parsol MCX (3), from DSM Nutritional Products - achieve this through a process of photo-induced geometrical (E -Z or cis -trans) isomerisation (Scheme 1). All three display a strong absorption band that peaks in the UVB region (290-320 nm).
Learning outcomes
In addition to learning about the Beer-Lambert law (see Box 1) and UV spectrophotometry and their importance within a commercial context, in this investigation students also learn about the mechanisms by which organic sunscreens function and their molecular structures. They learn how geometrical isomerisation affects absorption spectra and GC-MS data, and about 'photostability' in the context of sunscreens. They also get the opportunity to consider industry-specific jargon and units relating to these products and compare their measurements with data published by DSM Nutritional Products. Finally students use an online sunscreen simulator provided by Ciba, and formulate their own sunscreens online.
We use a variety of pre-lab activities with this practical. For example, we get the students to draw structures for different geometrical isomers of one of the sunscreens. We also make them do model calculations and research to find out the wavelength regions corresponding to UVA, UVB, UVC, visible and ir radiation, and the relative proportions of these penetrating the atmosphere to sea-level. We also discuss with students the different uv absorption properties of glass and quartz, and the differing biological effects of UVA and UVB radiation.
The experiments
We use this investigation in the first-year chemistry course but it can be adapted to suit students at other levels. Students work in pairs during two three-hour sessions. We split them into two groups of ~25-30 students with each group attending the laboratory on separate days. During the first laboratory session we introduce them to the equipment they will be using - spectro-photometers, auto-pipettes etc. Students process the data (some of which is specified to be done with the use of a spreadsheet) and use the Ciba sunscreen simulator outside the formal laboratory hours. The resources - laboratory script, technical data sheets, GC-MS data, the Skin and the Sun article2 etc - are provided as pdf files on Keele's virtual learning environment. Students are assessed via a structured, formal, individual laboratory report which they must complete and submit approximately two weeks from conclusion of the practical work. We are currently exploring other methods of assessment such as poster presentations (involving self- and peer-assessment).
Equipment and materials
-
Solutions of the three sunscreens of accurately known concentration (~10-4 mol dm-3) are made up by dissolving in methanol or ethanol. We recommend that you use good quality solvents because of the spectral region in which spectra are measured. Also do not rinse glassware with propanone (acetone) because this solvent absorbs in the UVC/UVB region, showing up as a broad band with a maximum around 270 nm.
- UV-VIS spectrophotometer, quartz cuvettes.
- Ultraviolet (313 nm) light source. (We use Foster & Freeman VSC4c video spectral comparators, but sunlight can be used, if available.)
HPLC grade methanol and ethanol.
Experimental and results
The practical has five parts.
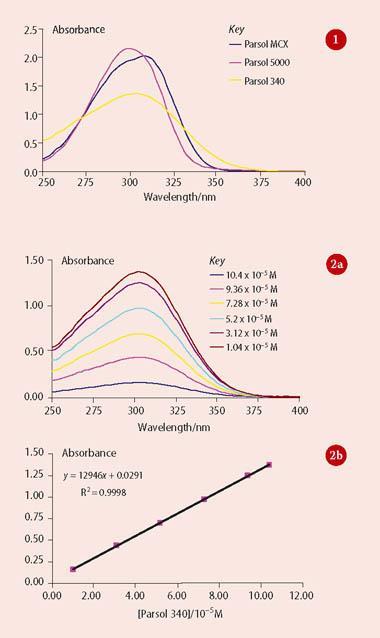
- Measurement of the uv absorption spectra of solutions of the three sunscreens. Figure 1 shows typical data acquired by our students for this part of the investigation. Their data are consistent with that reported by DSM to within ± 2 nm.
- Application of the Beer-Lambert law to determine the molar absorption coefficients, ε, of the three sunscreens. The students prepare a series of solutions of varying concentration (say 10-5 -10-4 M) by accurate dilution of the stock solutions in 5 ml or 10 ml volumetric flasks. They then record the absorption spectra of the different solutions and plot absorbance at λmax versus concentration to determine the molar absorption coefficient from the slope. Typical data are shown in Fig 2. DSM reports molar absorption coefficients as 'UV specific extinction' values (see Product sheet). These values represent the projected absorbance of a 1 per cent solution of the sunscreen in a cuvette of 1 cm pathlength. To compare their results with DSM's data, students need to convert the units of their own value or the DSM value. Converting the DSM value involves translating the 1 per cent solution into molarity and applying the Beer-Lambert law to obtain ε in dm3 mol-1 cm-1. For Parsol 340, DSM quotes a uv-specific extinction in the range 340-370, which converts to 12 291-13 375 dm3 mol-1 cm-1, in good agreement with the slope for the data in Fig 2 (b).
- An investigation of changes in the uv absorption profiles of the sunscreens after exposure to uv light.
The results for this part of the experiment are dependent on the properties of the uv light source used (eg s pectral intensity profile), but the effects are apparent using natural sunlight. At Keele the students expose the solutions to 313 nm uv light from a video spectral comparator for short (~10s) intervals and record the absorption spectra after each exposure. Model data are shown in Fig 3.
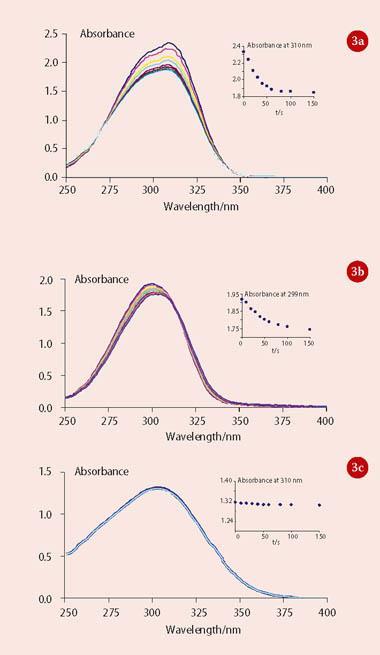
This part of the investigation illustrates the underpinning principle of the mechanism of these sunscreens (see Scheme 1). Where the two geometrical isomers are different (as for Parsol 5000 and Parsol MCX) then the exposure to uv light leads to a photostationary isomer mixture with a resulting modest modification to the uv spectral profile because the two isomers have slightly different uv spectra. This means that after a short period of exposure to uv light, both isomers are present in the solution and the rate of conversion of the trans to the cis isomer becomes matched by the rate of conversion of the cis to the trans isomer. The mixture is said to be photostationary (ie it shows no further spectral changes).
The precise composition of the photostationary mixture is dependent on numerous factors, including the properties of the uv light source. Importantly, a photostationary mixture is quickly established and it is this mixture that exhibits photostability in that its spectral profile remains constant for extended periods of uv exposure - ie both isomers are effective at absorbing uv and dissipating the energy via photoisomerisation (Scheme 2).
Parsol 340 undergoes 'photoisomerisation', but now both 'isomers' are identical so there is no significant change in its spectral profile as a result of exposure to uv light. The students learn an important point here - the sunscreen is not 'going off' or 'breaking down' - a photostationary, photostable isomer mixture is established which is what it is designed to do.
-
Use of GC-MS data (supplied to the students).
Supporting evidence that the spectral changes observed in the uv absorption spectra are attributable to geometrical photo-isomerisation is provided by GC-MS data. For example, a gas chromatogram (GC) of the Parsol MCX solution shows one component at RT 12.70, which is the trans -isomer (DSM GC data state that the trans -isomer constitutes more than 95 per cent, with the cis -isomer being present at no more than 0.5 per cent). Following exposure of the sunscreen solution to uv light, the GC now shows two components at RT 12.69 and 12.02, but the mass spectra of both components are identical to the mass spectrum of the single component (RT 12.70) prior to exposure. Generally, mass spectra of cis/trans isomers of a compound are identical, so the GC-MS data are evidence that exposure of the sunscreen solution to uv light leads to a mixture of cis and trans isomers. Similar GC-MS data are found for Parsol 5000 - Use of the Ciba online sunscreen simulator to investigate how SPF and UVA protection factors depend upon the combinations of sunscreens in a formulation, their spectral properties and concentrations (requires registration). Students formulate their own suncreams online.
The simulator calculates the SPF, UVA/UVB ratio, star rating and other parameters for a specified formulation of ingredients at specified concentrations. The program also returns the spectral absorption and transmission profiles of a model sunscreen film (ie a model of the sunscreen film on the skin)4 which the students can relate to the SPF and UVA protection factors, and the results can be saved as a pdf file for inclusion with the laboratory report. The simulator is used to do several tasks. - Students enter the concentrations of the three UVB sunscreens and find the maximum SPF achievable and the UVA/UVB ratio (and hence star rating), subject to the regulatory rules in Europe which prescribe maximum concentrations for each filter. The maximum SPF is found to be 20 and the star rating is one.
- Students design a sunscreen with an SPF of 15 and: (i) a low UVA/UVB ratio (eg 0.4, two stars); and (ii) a high UVA/UVB ratio (eg 0.8, four stars) - they have to adjust the concentrations of the UVB filters in conjunction with one or more UVA filters. The students are reminded that the star rating is related to the UVA/UVB ratio and is a relative term. So, in terms of the absolute attenuation of UVA rays, a four-star rating on an SPF 12 sunscreen is not the same as a four-star rating on an SPF 30 sunscreen.
And finally
The use of real contexts can enhance the scope of a practical in terms of what students can learn and do.5-7 From a combination of the student feedback and my own observations it is clear that the students generally enjoyed the practical, found it interesting and a good learning experience. They particularly enjoyed learning about the chemical properties and structures of sunscreens and, because the practical focused on commercial products, they felt it had a clear purpose. Some students, however, commented that the practical was too long and a bit repetitive, and that the write-up was very time consuming. There is also a lot to take in within the available time. On reflection, it is evident that the demands of the experimental work and the write-up could be significantly reduced while still achieving the desired learning outcomes. Future development of the practical will therefore focus on modifications to the design of pre-and post-laboratory work and a review of the overall information load and student workload.
Acknowledgements
I thank Ulrich Huber of DSM Nutritional Products AK, and Bernd Herzog of Ciba Specialty Chemicals for their comments on this article. I thank John Clews and Nicola Jennings for technical support and first-year Keele University chemistry/medicinal chemistry undergraduates (2005-06, 2006-07) and students on the Keele TDA Chemistry Enhancement Course (2006-07) for their valuable feedback. Finally, I thank The Higher Education Academy Physical Sciences Subject Centre for funding of a Development Project (2004).
Dr David J. McGarvey is a senior lecturer in the school of physical and geographical sciences at Keele University, Keele, Staffordshire ST5 5BG (e-mail: d.j.mcgarvey@chem.keele.ac.uk).
The Beer-Lambert law
The absorption of electromagnetic radiation by a homogenous medium is governed by the Beer-Lambert law, which relates absorbance (A) to the concentration (c in mol dm-3) of absorbing substance and the sample pathlength (l, in cm).
A =εcl
The Beer-Lambert law is of great practical importance in analysis and quality control. The quantity ε, the molar absorption coefficient, has units of dm3 mol-1 cm-1, and gives an indication of how strongly absorbing a substance is, at a specified wavelength (λ). In the uv-vis region, for example, ε approaches an upper limit of ~105 dm3 mol-1 cm-1 for strongly absorbing substances such as natural pigments (eg chlorophyll and β-carotene) and sunscreens.
A UV-VIS spectrophotometer is used to determine which wavelengths a substance absorbs and to measure absorbance (A) values (usually at the wavelength where the absorbance is strongest (λmax)) for solutions of differing concentrations (c). A plot of A versus cusing a sample of fixed pathlength yields a straight line from which ε may be obtained from the gradient of the line.
References
- J. R. Abney and B. A. Scalettar, J. Chem. Educ., 1998, 75, 757.
- Skin and the Sun, Roche Vitamins (DSM Nutritional Products AK, Switzerland), 2002.
- A. Cantrell, D. J. McGarvey and T. G. Truscott, in Sun protection in Man, Comprehensive series in photosciences, Chap 26, p 495, Vol 3, P. U. Giacomoni (ed). Amsterdam: Elsevier, 2001.
- B. Herzog et al, J. Pharm. Sci., 2004, 93, 1780.
- Simon T. Belt et al, Chem. Educ. Res. Prac., 2005, 6 (3), 166.
- Simon T. Belt and Sue B. Kendall, Educ. Chem., 2006, 43 (1), 15.
- Context-based experiments: [Website no longer available]


No comments yet