Interest in lead pollution has tended to focus on the environmental consequences of the use of tetraethyl lead in petrol and of lead compounds in paint. However, this element and its compounds have been trickling into the environment for thousands of years.
-
Environmental lead levels have fluctuated throughout history
-
Ice cores and peat bogs reveal historical trends in lead contamination where the lead came from
Lead has been known and used since antiquity. Because of its ease of extraction, its malleability and low melting point, the ancient Romans used the metal and its compounds extensively - in pots and pans, in plates and cups, in paints and cosmetics and even in the building of aqueducts.
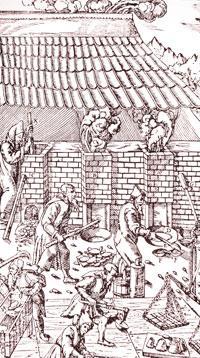
The Romans also mined lead ores, mainly galena (PbS) and lead carbonate, for their silver content, the basis of coinage. After reducing the ore to a mixture of lead and silver, they passed air over the hot mixture, which oxidised the lead to PbO. While most of the PbO was absorbed into the bone-ash pot in which the reaction was done, around one per cent was lost to the atmosphere, and spread by air currents.
Lead poisoning
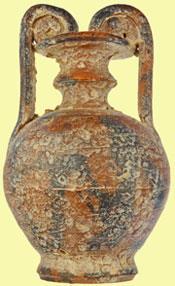
There are other ways in which lead and its compounds have, over thousands of years, entered the environment (and humans). For example, lead acetate, which like many Pb(ii) salts has a sweet taste, was formed from the reaction of leaden vessels with wine. Concentrated, the Romans used this sapa as a sweetener and the lead poisoning that ensued is thought, albeit controversially, to be in part responsible for the 'decline and fall of the Roman Empire'.
Traditionally known as 'sugar of lead', sapa was replaced by lead oxide in the 14th and 15th centuries to sweeten wine, which caused colic, symptomatic of lead poisoning.
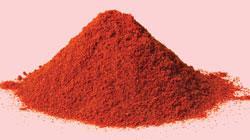
More recently, in the 1980s lead poisoning was linked with moonshine whiskey made using lead vessels, pipes and stills. There have been many other incidents of lead poisoning.1 In the mid-1990s lead oxide was illicitly added to Hungarian paprika as a colourant and in China in 2009 lead smelters were closed because more than 2000 children in the local vicinity had been found to have high levels of lead in their blood. One eight-year old boy's blood contained 239μg of lead per litre, which is ca five times the safe level.
Lead analysis
The measurement of lead in the environment, deposited over thousands of years on lake sediments, peat, soils and even Greenland snow was pioneered by the US scientist Clair Cameron Patterson (1922-1995).
Before man started to work lead ores, the source of lead in the environment was simply wind-blown dust from soil. Very small particles (below 5 mm in diameter) could be transported thousands of miles from Saharan Africa to Greenland ice.
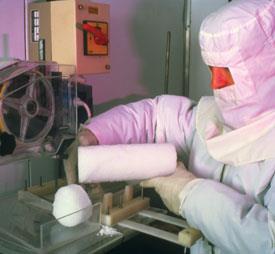
Patterson developed ultra-clean methods for sampling and handling samples of ice and snow. He used tools made of Teflon, polycarbonate and acid-cleaned stainless steel, and in the laboratory scientists, clad in special 'clean-room overalls' handled the samples in ultra-clean cold rooms.2 Ice drilled from deep down also had to be decontaminated, done simply by disregarding the outer part which had been in contact with the atmosphere.
To measure the very low lead concentrations, the scientists used Isotope Dilution Thermal Ionisation Mass Spectrometry (IDTIMS), Laser Excited Atomic Fluorescence Spectrometry (LEAFS) and Inductively Coupled Plasma Sector Field Mass Spectrometry (ICP-SFMS). Isotope ratios were measured by mass spectroscopy, while the ages of samples were established by 14C and 210Pb dating.
As early as the 1960s Patterson realised that much more lead was entering the environment than in pre-industrial times. Many scientists, he discovered, had grossly underestimated the problem, because they had used contaminated 'blank' background samples. In 1969 he published the results of an investigation of the lead in Greenland ice,3 which revealed that lead concentrations increased by a factor of at least 200 between 800 BC and AD 1969, with the sharpest rise after 1940. He concluded that the increase before 1940 was from lead smelting, and since 1940 attributable to the use of lead alkyls in petrol.
In a later study of albacore tuna published in 1980,4 Patterson and his co-worker Dorothy Settle showed that commercial packed tuna contained around 10 000 times as much lead as sea-water dwelling fish. They attributed much of the increase to lead from the soldered cans entering the food chain. Consequently, just as a programme began in 1973 to remove lead from US petrol, subsequent campaigns were launched to take lead out of paint and canning.
Further investigation of Greenland ice5 covered the period up to 7760 years before the present time, with samples taken at depths up to 1286.5 metres below the surface. The results showed that even in the period covering the peak of ancient Greek and Roman civilisations between 1700 and 2500 years before the present, lead levels in the ice were much greater than natural values, reflecting the extensive mining of lead ores in the Greek and Roman Empires. Scientists estimated that the total lead fallout on the Greenland ice sheet from Greek and Roman mining during this 800 year period was about 15 per cent of that from the use of lead alkyls in gasoline during the 20th century.
Lead isotope studies
Study of the lead isotopes present in samples in the late 1990s pointed to the likely source of the lead.6 The 206 Pb/207 Pb ratio in Greenland ice samples showed a decrease in the ratio from above 1.20 until 962 BC to values of the 206Pb/207Pb ratio as low as 1.1828 in 43 BC. These values could be attributed to lead mining from the Rio Tinto mines in south western Spain (with some coming from the Cartagena mine in south east Spain), which were extensively worked for their silver-rich lead ores.
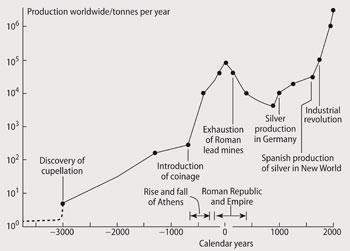
Fig 1 shows that the high level of lead mining during the Roman Empire fell during the Dark Ages, to be revived in the Middle Ages and with the coming of the Industrial Revolution, production intensified.
Similar patterns have been found in other sources, such as peat bogs and lake sediments, in other parts of the world, including one from Lindow bog, south of Manchester.
Fig 2 shows lead contamination predating the Roman occupation of Britain (indicating the existence of a mining industry). Extraction of lead ceased with the onset of the Dark Ages, but production resumed in the mediaeval period and rose sharply during the Industrial Revolution. The 208Pb/206Pb and 206Pb/207Pb isotopic ratios in the peat during the period 200 BC-200 AD indicates that the contamination was caused by English lead ores, not Spanish ones. The top part of the peat was missing, so that no study of lead levels post-1850 was possible.
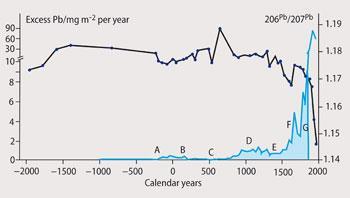
Samples from a Swiss peat bog7 from the present day to over 10 000 BC led to similar findings. Additionally, data for the 20th century showed a significant rise in lead levels following the introduction of leaded petrol, and a corresponding fall since the coming of unleaded petrol in the late 1970s. At the same time, the use of leaded fuel caused a drop in the 206Pb/207Pb ratio from ca 1.16 to ca 1.12, from 1936-1979, corresponding to the lead content in the petrol then in use in Switzerland. Moreover, over the years 1976 to 1991, mean blood lead levels of persons aged 1-74 dropped by 78 per cent, from 0.62 to 0.14μmol l-1(12.8-2.8gμ decilitre). Similar patterns were seen in childrens' lead levels.8
Concern continues9, 10, however, about the effect upon children's IQ of even concentrations of 10μg per decilitre or less. (In the 1990s Herbert Needleman found high bone lead levels were associated with lower IQ, poor attention, aggression, and delinquency.)11 There is also concern, especially in the US, over the number of old buildings that still contain lead paint. Flakes of paint falling off the buildings are a potential danger for children, and there is also the possibility of toxic lead-containing dust being generated when such old buildings are renovated
Simon Cotton is a chemistry teacher at Uppingham School, Rutland LE15 9QE
Lead isotopes
Lead has four stable isotopes. Of these, 204Pb does not arise from a radioactive precursor, but 206Pb is the final element in the decay chain of 238U, 207Pb is the final element in the decay chain of 232Th and 208Pb is the final element in the decay chain of 235U. The isotopic composition of lead in nature is variable because different lead ores have received different contributions of different isotopes from uranium and thorium decay. The 206Pb/204Pb and 206Pb/207Pb ratios commonly found in lead ores throughout the world generally range between 16.0-18.5 and 1.19-1.25, respectively. However, the lead ore from Broken Hill, Australia, has a very low 206Pb/207Pb ratio (1.03-1.10), and this ore has been widely used to make tetraethyllead (and tetramethyl lead) used in European petrol. On the other hand, lead from the Mississippi Valley ore deposit, US, has a greater radiogenic lead isotopic composition (206Pb/204Pb ~ 20.0; 206Pb/207Pb = 1.31-1.35), so that US leaded gasoline typically had significantly higher 206Pb/207Pb ratios than in European petrol.
Acknowledgements
I am very grateful to Professor Claude Boutron for supplying several reprints.


No comments yet