


Tried-and-tested tips to transform learners’ investigative, graph-drawing and data-logging abilities
In his article on maximising practicals, teacher trainer Colin McGill suggests using technology to enhance accessibility and inclusivity. If SEND students benefit, it follows that other students will, too.
Teacher trainer Colin McGill suggests using technology to enhance accessibility and inclusivity in his article on maximising practicals (rsc.li/45PETct). If SEND students benefit, it follows that other students will, too.
While the development of graph-drawing skills, for example, is essential, if the purpose of the practical focuses explicitly on improving the use of apparatus and investigative skills, why not let technology do the heavy lifting? Visualising data particularly benefits those who may require additional time for drawing graphs by hand.
But not all technology has to have bells and whistles to be effective – simple spreadsheet applications can suffice.
When I was still teaching, to widen participation in chemistry we invited groups of 13–15 year-olds to take part in activities, one of which involved an iodine clock competition.
I faced the challenge of completing the activity in 45 minutes with groups of pupils from a wide range of backgrounds. The winning criteria were to achieve the best results by varying the concentration of one of the solutions and accurately recording time for the colour change.
As results started to arrive, pupils recorded them into a shared spreadsheet. Excitement grew as the charts, simple scatter graphs pre-programmed to display lines of best fit, were projected onto the screen. Teams discovered that, by refining measuring techniques and repeating runs, their R2 approached 1 and so did their shot at victory.
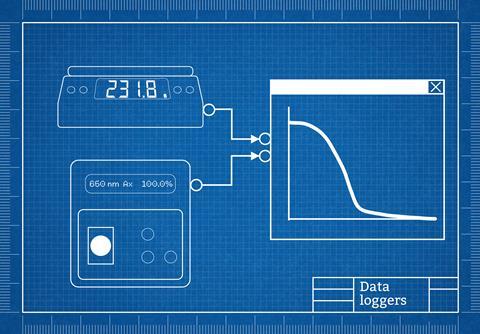
Data-logging: predict, observe, repeat
Data loggers can be invaluable in developing investigative skills and they’re particularly useful when teaching continuous monitoring. Thanks to an industry sponsor (Solvay) at my old school, we had some reasonably priced electronic balances and colorimeters that we could easily link to software.
You don’t need a class set, because you can use a demonstration rather than asking all your learners to do the experiment. For example, when you show learners the marble chips and hydrochloric acid reaction, arm them with mini whiteboards and ask them to sketch a graph of loss of mass versus time. Test their predictions by running the experiment live on a digital top pan balance linked to data-logging software. I used Ohaus as it was cheap and easy to set up.
Build up the tension as you mix the reagents and the software plots the graph. Are they hastily erasing incorrect predictions, or nodding with satisfaction at their accurate models?
Technician Sandrine Bouchelkia describes a novel adaptation of the disappearing cross experiment using colorimeters linked to data-logging software. She told me this is ‘closer to a method that would be used in industry’.
Investigation of the iodination of propanone using this method is an excellent tool for teaching rate equations post-16. Students predict the shape of an absorbance versus time graph as the colour of iodine dissipates in the reaction. Increase the challenge by asking them to predict the gradient for a second run, if the iodine concentration is increased (see my video for instructions). When the actual graphs generated confirm or challenge their predictions, they develop a deeper understanding of zero order reactions.
Perhaps the most valuable technology-enhanced learning moments occur when results defy expectations. Introduce the rates and rhubarb experiment. Could pupils predict the shape of the graph as potassium manganate(VII) solution decolourises? This method is a great way to address the phenomenon of autocatalysis.
Investigation of the iodination of propanone using this method is an excellent tool for teaching rate equations post-16. Students predict the shape of an absorbance versus time graph as the colour of iodine dissipates in the reaction. Increase the challenge by asking them to predict the gradient for a second run, if the iodine concentration is increased (see my video for instructions: bit.ly/3GhrzDc). When the actual graphs generated confirm or challenge their predictions, they develop a deeper understanding of zero order reactions.
Perhaps the most valuable technology-enhanced learning moments occur when results defy expectations. Introduce the rates and rhubarb experiment (rsc.li/44EbEbe). Could pupils predict the shape of the graph as potassium manganate(VII) solution decolourises? This method is a great way to address the phenomenon of autocatalysis.
Despite the clear benefits, documented in research and the rapid adoption of digital technology in the real world, barriers to the use of data logging in schools remain. This includes equipment costs, software obsolescence, technician shortages and professional development opportunities for inquiry-based teaching with technology. The 2024 Gatsby report on CPD highlights these challenges, suggesting that realising technology’s potential requires systemic support beyond individual teacher innovation.
More resources
- Read our guide to teaching monitoring reactions.
- Discover research-informed tips for teaching reaction rates using graphs.
- Find out if using data loggers in science lessons is beneficial for learners in this paper from the Journal of Information Technology for Teacher Education.
- Read our guide to teaching monitoring reactions: rsc.li/4lsYFim
- Discover research-informed tips for teaching reaction rates using graphs: rsc.li/45KwWoQ
- Find out if using data loggers in science lessons is beneficial for learners in this paper from the Journal of Information Technology for Teacher Education: doi.org/10.1080/14759399800200040


Tech talk
From overhead projectors to AI, our new series explores educational technology and how teachers are using it to their advantage
- 1
- 2
 Currently
reading
Currently
reading
Digital boost for practical skills
- 4
- 5


No comments yet