


Investigating the structure and properties of cellulose that make cotton clothes feel comfortable provides a real context for laboratory work in an undergraduate experimental spectroscopy course.
-
Students determine surface areas of cellulose samples using dye adsorption and uv-vis spectroscopy
- Results provide insight into how cotton's structure affects its suitability for clothing

One of the first industrial processes to rely on adsorption was dyeing of cotton by synthetic dyes. Today the textile industry produces approximately 20 million tonnes of dyed cotton per year.1 We have used the context of cotton as a textile to make laboratory work in our undergraduate experimental spectroscopy course more interesting by challenging students to design an uv-vis experiment to answer the question 'why does cotton feel "cool"?'.
Background and pre-lab activity
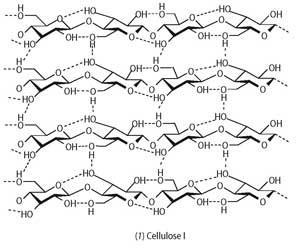
Cotton is a cellulose-based polymer comprising d-glucopyranose units joined by β-1,4-glycosidic linkages. The cellulose chains crosslink via intermolecular hydrogen bonds. The resultant system coalesces to form microfibrils that are further organised into macrofibrils, and subsequently into fibres. Cellulose has at least four distinct crystalline structures, the most common of which are cellulose I (1) and cellulose II. The latter has less hydrogen-bonding than the former.2a
So why does a cotton shirt feels more comfortable than one made of its blend with a synthetic fibre, eg polyester or polyamide, especially when it is hot and humid? We put this and other questions to 46 undergraduate chemistry students on our experimental spectroscopy course. This course is run in the fifth semester of our eight-semester BSc chemistry programme by which point the students have taken courses in organic and physical chemistry, but not in polymer chemistry. Practically all students attributed the difference in feel between cotton and cotton-synthetic blend materials to the fibre's capacity to absorb moisture (sweat) because of the presence of three OH groups in each anhydroglucose unit.
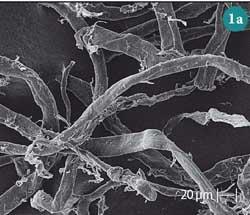
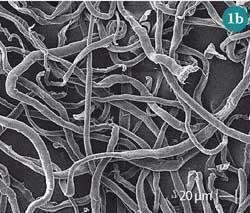
Next we showed the students scanning electron microscopy (SEM) micrographs for untreated cotton and mercerised cotton fibres (Fig 1 (a) and (b)). We explained that mercerisation is a treatment used in the textile industry to increase the strength of cotton fibre, as well as give the fabric a lustrous appearance and increase its affinity for dyes.3 The process involves treating cotton under tension with sodium hydroxide followed by an acid bath to neutralise the treated fabric. Based on the SEM micrographs we asked the students to comment on the effect this treatment has on cellulose. Most of them identified the change in morphology, ie the fibres become smoother and less entangled because NaOH decreases hydrogen bonding between the biopolymer chains and 'peels' the small fibrils present at their surfaces.
This treatment, however, also results in:
- transformation of cellulose I into cellulose II;
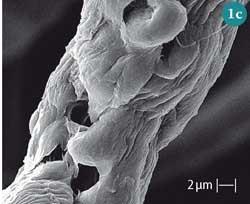
- an increase in fibre surface area caused by the expansion of the volumes of the micropores present (Fig 1 c)) and unification of adjacent ones; and
- a decrease in its index of crystallinity (Ic), which is the ratio of crystalline and amorphous regions in cellulose.4 Being less organised, the amorphous regions are more 'accessible', ie more easily penetrable than their crystalline counterparts. Consequently, mercerisation makes the cellulose polymer surface more accessible, leading to enhanced water sorption and reactivity in chemical reactions.5
We then asked the students to estimate the magnitude of the 'apparent' specific surface area of cellulose fibres. We use the term apparent because dye adsorption includes several interactions, in particular hydrogen bonding and van der Waals forces. Dye aggregation may also occur, leading to an uneven coverage of the (irregular) fibre surface. We provided the students with three alternatives: <1m2g-1; 1-10m2g-1; >10m2g-1. One half of the group selected the latter option while answers from the remaining students were split evenly over the other two options.
Finally, we asked them to plan an experiment to determine the surface area of cellulose by using dye adsorption. All students outlined the experiment correctly - compare dye concentrations in the bath before and after dyeing. Two-thirds of the students provided details of the necessary calculations, and of these 17 per cent linked fibre dyeing to an adsorption isotherm. The students then did the experiment.
The experiment
The experiment requires two four-hour laboratory periods, and the students work in several groups. To make the most of students' time in the laboratory, staff should do parts one and two before the first lab session. Students do parts three and four. In the first session, the students prepare dye solutions, construct Beer's law plot, and add untreated and mercerised cellulose samples into dye baths. In the second, they measure the absorbances of the supernatants, do the calculations and report their results.
1. Preparation of untreated and mercerised cellulose samples
Cut cotton sheets into strips and grind these in a water-cooled cutting mill. Sieve the ground cotton through a 100-200 mesh sieve. Alternatively, you can use commercially available powdered cellulose, such as that used for column chromatography, as the starting material.
To make a sample of mercerised cellulose add powdered cellulose (15g) to 500cm3 of cold NaOH solution (0°C, 17.5 wt per cent alkali, containing 1.5g of NaBH4) and stir for one hour. Filter the slurry through a sintered-glass funnel and wash with cold water (500cm3), cold, 5 per cent ethanoic acid solution (15cm3) and then with cold water until the pH of the filtrate is neutral. Air dry the final product.
2. SEM micrographs
To obtain the SEM micrographs we used a Leo 440 electron microscope, operating at 10kV and using a tungsten filament electron source. Samples were sputtered with platinum and scanned at room temperature.
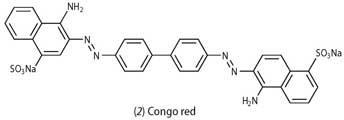
3. Surface areas of wet celluloses, calculated from adsorption of congo red dye
Congo red (CR) (2) is a bisazo direct dye, with a molecular weight of 696.67gmol-1. We use a certified grade dye (dye content >93 per cent, further purified by recrystallisation from water-ethanol 1:3, v/v and air dried).6 The students prepare dye solutions comprising 1gdm-3 NaCl with varying concentrations of CR ranging from 0.02 to 0.37gdm-3. Then they make up suspensions of untreated and treated cellulose in the dye/NaCl solutions (0.5g cellulose per 25cm3 dye solution) and leave these to equilibrate overnight in an oven set at 60 ± 2°C. At the start of the second lab session the students cool the solutions to 25°C and measure the uv-vis absorption of the supernatant, either directly or after dilution with water, using a uv-vis spectrophotometer.
The students calculate all dye concentrations from a Beer's law plot of dye absorbance at 492 nm against its concentration. The conditions we used were: 1cm path length cell; dye concentration = 1.71 × 10⁻⁵ to
4.32 × 10⁻⁶ moldm-3; 25°C. The calculated molar absorbitivity of CR was 37861dm3 mol-1 cm-1 and the correlation coefficient of Beer's law plot 0.9978.
4. Treatment of effluents
When the experiment is finished students should precipitate CR from solutions by adding an acidified (pH ca 4) FeCl3 solution (10 mol per cent excess over dye). The (coarse) black ferric salt of the dye is readily removed by filtration.
Special tips
We recommend using cellulose of a uniform size (100-200 mesh) in order to obtain reproducible results in (heterogeneous) dyeing. We mercerise the cotton in the presence of a reducing agent, NaBH4, to avoid oxidative degradation of cellulose.7 The ionic strength of the dye solution can alter dye adsorption so the experiments should be done in presence of a constant ionic strength, maintained by NaCl.
Results and discussion
Often, the shape of experimentally determined dyeing curves resemble the classical Nernst- (N), Freundlich- (F), and Langmuir-type (L) adsorption isotherms, see Fig 2 (a). These are generally applicable to the sorption of gases by solids (F, L) and the distribution of solutes between partially miscible solvents (N).8 The students' results (Fig 2 (b)) show that the Langmuir-type isotherm is observed, which is in agreement with literature data for dyeing untreated, mercerised, and regenerated celluloses, such as lyocell fibre.9 The units used for the concentrations of residual CR in the bath, and CR adsorbed on fibre are not the same, but this use is customary.8,9 The 'plateau' concentration is taken as the maximum amount of dye adsorbed by the fibre, which is 30.7 and 47.2g dye per kg fibre for cotton and mercerised cotton, respectively. Using these limiting concentrations, Avogadro's number, and the area per CR molecule, taken as 5.39nm2,9a the students calculated the specific surface areas for untreated and mercerised cotton fibres as 143.0 and 219.8m2 g-1 respectively.
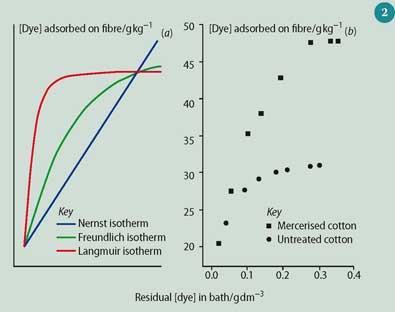
Figure 2 (b) shows that mercerisation leads to an increase in surface area of cotton fibres caused by widening of the existing capillaries, voids, or fibrillar interstices in the fibre morphology. The accompanied increase in the accessible internal surface of cellulose is important for absorption of water, dyeing, and reactions to transform cellulose into derivatives, eg esters.2b
And finally...
We find that the use of real contexts enhances the scope of the experimental course in terms of what the students learn and do. Feedback from the students shows that they enjoyed the experiment, the way that we put the problem to them, and learning how the microscopic structure of cellulose affects its suitability for clothing. Through doing this practical they also learn that accessibility is an important aspect of polymer chemistry, unlike small molecules in solution, where all material is available for reaction.
The experiment may be a bit laborious, but the calculations are simple and it is more interesting than a 'classic' quantitative uv-vis experiment, eg determination of metal ions,10a or of the pKa of an acid-base indicator.10b In principle, the surface area of cellulose can be determined by using N2 adsorption and applying the Brunauer, Emmett, and Teller (BET) equation.11 The equipment required, however, is not a part of most undergraduate laboratories, and the students' involvement in the BET experiment would be limited. Additionally, the area of wet cellulose is more relevant to dyeing than that determined (for the dry sample) by the BET method.8
And the answer to the question? It is the structure and morphology of cotton, the polarity of its fibres, and their large surface area and high absorbance capacity for water that make cotton clothes feel 'cool' and comfortable.
References
- Cotton: world markets and trade: US Department of Agriculture, Circular series FC 05-02. Washington DC: US Department of Agriculture, Foreign Agriculture Service, 2002.
- H. A. Krässig, Cellulose structure, accessibility and reactivity, (a) p 6; (b) p 167. London: Gordon and Breach, Yverdon, 1992.
- D. Klemm et al, Comprehensive cellulose chemistry, Vol 1, p 15. Weinheim: Wiley-VCH, 1998.
- P. Langan, Y. Nishiyama and H. Chanzy, Biomacromolecules, 2001, 2, 410.
- S. H. Zeronian, J. Appl. Polym. Sci., 1970, 14, 365.
- W. L. F. Armarego, Purification of laboratory chemicals, 5th edn. Elsevier: New York, 2003.
- V. M. Irklei et al, Fibre Chem., 2005, 37, 452.
- H. Zollinger, Color chemistry, p 389. Weinheim: VCH, 1991.
- (a) M. K. Inglesby and S. H. Zeronian, Cellulose, 2002, 9, 19; (b) F. Carrillo, M. J. Lis and J. Valldeperras, Dyes and Pigments, 2002, 53, 129.
- (a) G. S. Patterson, J. Chem. Educ., 1999, 76, 395; (b) A. Rogers, Educ. Chem., 1986, 23, 18.
- S. Lowell, J. E. Shields, Powder surface area and porosity, 3rd edn, p 52. London: Chapman and Hall, 1991.


No comments yet