Tips for teaching maths skills to our future chemists, by Paul Yates of Keele University. In this issue: displaying data
Information is redundant if not shared, so being able to communicate numerical data is important. Additionally students need to be able to express their experimental data in an appropriate way for assessment purposes, and so they must be able to organise data in a meaningful way.1 Generally, data are displayed using tabular or graphical techniques, or both.
What difficulties do students have?
I find that students are better at interpreting, rather than constructing, graphs.2 Many are reluctant to tabulate data, preferring lengthy repetitive text which is occasionally punctuated by the quantities they want to report. When it comes to drawing graphs, some students have problems choosing the right scale and the origin, and units pose problems whether they are displaying their data in a table or on a graph.
How is this best taught?

Research distinguishes between qualitative (interpreting trends) and quantitative (reading values) activities, and stresses the importance of encouraging students to construct graphs.2
Table or graph?
A table may be the final form in which data are published, or it may be a preliminary stage in the construction of a graph.3 A table has the advantage that a required number of significant figures may be quoted, whereas in a graph this is limited by the size of the graph and the range of the data. On the other hand, data in a graph can be interpolated and extrapolated rapidly, if accuracy is not an immediate requirement. Trends can be detected in graphs that would be unlikely to be detected if the data were given in tabular form only.4
Units in graphs and tables
Most physical chemists agree that the figures in the body of a table, or plotted on a graph, should be pure numbers, and that the units need to be stated on table headings or axis labels. This approach also has the advantage that we can unambiguously include powers of 10. In the worked example we have a table heading of [NH3]/10-7 mol dm-3, and the third entry in this column is 5.84. If we equate these we have
[NH3]/10-7 mol dm-3 = 5.84
and multiplying both sides by 10-7 mol dm-3 gives
([NH3]/10-7 mol dm-3) × 10-7 mol dm-3 = 5.84 × 10⁻⁷ mol dm-3
or
[NH3] = 5.84 × 10⁻⁷ mol dm-3
A similar argument applies when reading data from graphs. Alternatively, you could use the column heading [NH3](× 10-7 mol dm-3).4 The question immediately arises as to whether the numbers in the table have been multiplied by 10-7, or need to be multiplied by 10-7. The previous approach, I believe, removes this ambiguity.
Guidelines for tables
Reference 5 contains some useful guidelines for presenting data in tables. For example:
-
use headings at the top with data in columns, as opposed to side headings with data in rows;
-
tabulate in ascending or descending order of the independent variable. For example, when measuring concentration as a function of time, time is the independent variable since the time at which readings are taken is chosen by the experimenter;
-
vertically align decimal points in each column. This advice can be extended to include values without decimal points, where powers of 10 should be vertically aligned, as in the worked example;
-
box in all headings and tabulations by ruled horizontal and/or vertical lines.
Further suggestions include rounding all figures to two significant figures and including row and column averages.5 However, it may not be wise to share this advice with students as general rules because they might be tempted to apply them without exception. Figures to be compared need to be close, while at the same time incorporating gaps to guide the eye across the table. This applies to tables with large amounts of data, so might be useful for extended student projects.
Guidelines for graphs

References 1 and 6 give some useful advice for presenting data on graphs, including:
-
the title should describe the relationship being investigated;
-
plot the independent variable on the x -axis and the dependent variable (ie not controlled by the experimenter) on the y -axis;
-
label the axes with names of quantities being measured and their units;
-
choose scales so that the page is filled;
-
only include the origin if specifically needed. Usually this would be if the range of data included or went close to the origin. Intercepts of straight lines can be calculated much more accurately than they can be read from a graph;
-
choose simple scales: factors of two, five and 10 are much easier than three or seven. The latter scales make points very difficult to plot and are far more likely to lead to mistakes;
-
plot data points using an appropriate symbol. Some authors4 suggest that the symbol representing the data point should be too large rather than too small, but others6 suggest × or ⊙, which I think are preferable because they are visible without obscuring the actual position of the point.6 Others suggest that different symbols should be used to represent data collected under different conditions;5
-
join the points with the smoothest curve possible so that half the points lie above and half below the line. The term 'curve' is used here in its most general sense; this will be a straight line in certain cases. No departure from a smooth curve should be accepted unless there are several neighbouring points supporting this course of action.
Final thoughts
Opinion is divided on whether graphs should be plotted as an experiment proceeds, or after the experimental work has been done. The advantage of the former is that any unusual points can immediately be investigated, whereas in the latter the experimenter will know the range of the values to be plotted. A compromise is to plot the graph at the end of the experiment, but keep the apparatus available to allow any dubious measurements to be repeated.
There are certain pitfalls when graphs are generated automatically using a computer. When judging the appearance of the final graph the considerations already outlined still apply, and appropriate user intervention may be required to achieve this. In particular, axis labels, including units with subscripts, superscripts, or Greek letters may need to be generated by a word processor with 'cut and paste' used as appropriate.
Worked example
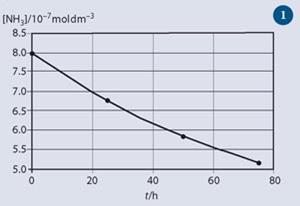
These data7 relate to the thermal decomposition of ammonia at 2000 K:
NH3(g)→ NH2(g) + ½H2(g)
Tabular representation
Thermal decomposition of ammonia
t/h [NH3]/10-7 mol dm-3
0 8.00
25 6.75
50 5.84
75 5.15
Graphical representation
This was produced using the program Microsoft Excel. The range of values on the y -axis starts at 5.0 (rather than zero) and all numbers on the axis are given to one decimal place. Axis labels and the title were added using text boxes in Microsoft Word and pasting from the table. (Note that the symbols recommended in the main text are not available, but choosing a suitable size for the symbol does make them sufficiently visible.)

References
- E. A. Steele, K. A. Kelsey and J. Morita, Environ. and Ecolog. Stat., 2004, 11, 21.
- H. H. Tairab and A. K. K. Al-Naqbi, J. Bio. Educ., 2004, 38, 127.
- P. D. Lark, B. R. Craven and R. C. L. Bosworth, The handling of chemical data. Oxford: Pergamon, 1968.
- L. Kirkup, Experimental methods. Brisbane: Wiley, 1994.
- A. S. C. Ehrenberg, J. Roy. Stat. Soc., Series A (General), 1977, 140, 277.
- M. Pentz and M. Shott, Handling experimental data. Milton Keynes: Open University, 1988.
- J. C. Kotz and P. Treichel, Chemistry & chemical reactivity, 3rd edn. Forth Worth: Saunders College, 1996.


No comments yet