


Learn how to make sure students see graphs as more than just pictures and representations

Graphical representations are an intrinsic aspect of the study and practice of chemistry. Expert chemists can conceptualise graphs in myriad ways: they can plot results, spot the pattern, and their graph becomes a memory trigger for their findings. This does not follow for novice chemists. Students carrying out a graph plotting activity after a practical are far more likely to remember the mechanical practice of drawing scales, plotting points and drawing a line of best fit than the shape of the graph or how this relates to the properties they were investigating.
In chemistry lessons students will meet hundreds of graphs, of four general types:
- to interpret information and manipulate data to make deductions
- to represent findings or data
- to illustrate texts and make them more engaging
- to facilitate the transformation of a conceptual idea into something concrete and memorable.
Unlike experts, novices don’t automatically see graphs as mathematical objects which can be manipulated logically – they see pictures and representations, rather than tools. Their neat, well-drawn graph is your chemical law.
Graphing in maths
Students first encounter graphing in primary maths and science: they plot data points on scales and take readings. However, approaches to graphing in maths and science diverge at ages 11–14. Chemistry lessons remain focused on drawing graphs to represent experimental data, whereas in maths graphs transmute into expressions of mathematical functions. They form a new ontological category.
Maths for ages 11–14 will generally approach graphing from two different angles:
1. Using y = f(x) to determine y values and plotting on a 1:1 scale grid
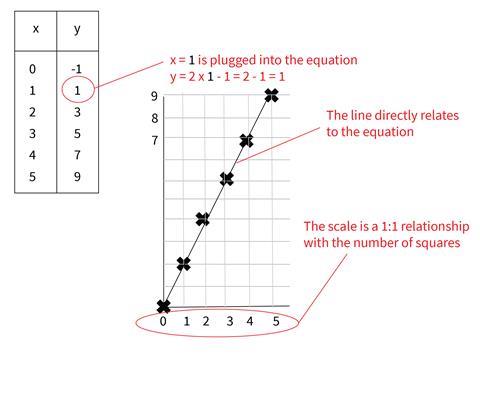
This approach builds students’ familiarity with y = f(x) functions. Although it isn’t made explicit in maths lessons, this method clearly shows the x values as the ‘independent’ variables and y values as ‘dependent’ on how the function acts on the x value.
2. Sketching straight line graphs given the equation by determining the gradient and y-intercept
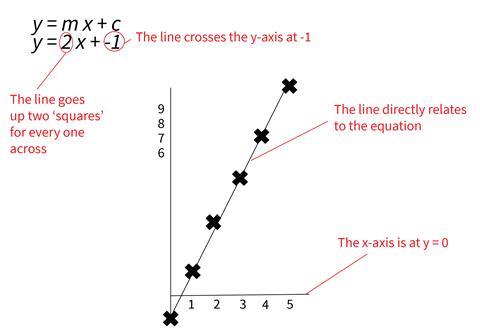
Students rearrange equations into the form y = mx + c. The m is the gradient of the line (the number of values the graph goes ‘up’ for each one across) and the c is the y-intercept (the value where the line crosses the axis).
An advantage of this approach is that it clearly shows that line is not joining up discrete points but represents the function itself – the relationship between x and y.
Understanding scales
Many of the scales students meet in maths are 1:1, allowing them to bypass converting values using ratios. In chemistry, students can struggle to conceptualise scales as ratios, often drawing non-linear scales and choosing inappropriate scales. Fraser Scott’s article on choosing appropriate scales provides some excellent guidance and resources on this misconception.
Many of the scales students meet in maths are 1:1, allowing them to bypass converting values using ratios. In chemistry, students can struggle to conceptualise scales as ratios, often drawing non-linear scales and choosing inappropriate scales. Fraser Scott’s article on choosing appropriate scales provides some excellent guidance and resources on this misconception (rsc.li/2YJDLU9).
You could also ask students to plot a 1D scale on a piece of paper in a 1:2 ratio by drawing a 20 cm line and labelling the two ends 0 and 40, for example. They then measure their line and divide by two to find the middle (at 10 cm). In the same way, they halve 40 (the maximum on the scale) to get 20, and label the middle of their line. They repeat this process to mark up their axis. Students who are struggling can fold their paper to find the halfway points while making their scale. This process decouples representative graphing in chemistry from being a ‘picture’ of the process, and reinforces the mathematical principles behind the scale. It treats the graph as a mathematical object.
Conceiving abstract graphs as mathematical objects is necessary to manipulate chemical graphs and laws, so if students are struggling with a particular skill, devote some class time to this. The diagnostic exercise in the downloads assesses students’ grasp of graphing and relates these ideas to simple chemical laws. You can find further resources to support graphing in the article ‘How to teach pupils to use the right graph’.
Conceiving abstract graphs as mathematical objects is necessary to manipulate chemical graphs and laws, so if students are struggling with a particular skill, devote some class time to this. The diagnostic exercise in the downloads assesses students’ grasp of graphing and relates these ideas to simple chemical laws. You can find further resources to support graphing in the article ‘How to teach pupils to use the right graph’ (rsc.li/2EsKR8S).
Download this
A diagnostic exercise as MS Word or pdf, plus a cooling curves practical and graph-drawing exercise as MS Word or pdf.
Heating and cooling curves can be drawn at different levels of abstraction: the representative graph of a particular experiment, the universal graph for the substance being analysed, and an even more abstract ‘generic’ curve showing the overall pattern. The worksheet takes students through the levels to consider the role of different graphs.
Universals and particulars
Students need to understand that a graph can be either a representation of a particular, or of a universal.
The ontological status of graphs in chemistry is nuanced: some graphs represent universal chemical laws, such as ΔG = ΔH – TΔS or Q = mCΔT, others show the imperfect results of an experiment, and some, like graphs showing ionisation energies or electrical conductivities, appear to blur these boundaries. These graphs will inevitably have errors (random and systematic), anomalies and general ‘noise’, somewhat obscuring the results pattern.
Conversely, graphs which show a mathematical relationship are universals, such as reaction profile diagrams and Maxwell-Boltzmann distributions. Many of the diagrams in books and exam questions show a representation which eliminates noise or error and clearly shows the pattern or chemical law (the equation). These kinds of graphs are the ones used as memory triggers for concepts. Ionisation energies and conductivities fall into this category, despite the highly complex equations which govern them.
A particular graph approximates a universal graph. The best fit curve is a closer approximation of the universal as it minimises the impact of random error, and helps elucidate the overall pattern of results. Systematic error prevents the best fit curve from being the universal.
In maths, all graphs that students encounter are universals: the points are all perfectly on the line. Consequently, particular graphs from experimental data in chemistry don’t conform to students’ expectations for mathematical objects. Even a ‘good’ data graph will have points on either side of the best fit line.
How to help
- When looking at particular graphs of phenomena, explicitly transform the graph into a universal to point out overall trends, ideally next to the original rather than on the same axis so students can see the trend clearly, minimising cognitive overload. This models how an expert eliminates noise when looking for patterns.
- Explicitly discuss the equation of the graph when analysing universal graphs. For a straight line graph, relate it to y = mx + c, switching the y and x for the experimental variables and identifying whether m is positive or negative (even if you can’t identify the actual value) and whether c is zero or non-zero. For a non-quadratic curve, you could use software to approximate the equation to ‘prove’ to students that it’s still a mathematical function. This challenges students’ assumption that there’s a fundamental difference between graphs in different contexts.
- For straight line maths graphs, all points will be on the line – the equation (which generates the points) and the graph both represent the same mathematical relationship. This works because, in maths, the students already know the universal equation when they are generating the points. In chemistry, investigation is required to work out the universal equation. Discussing this process with students helps them understand that the best fit line is an approximation of the universal equation, which we can then determine if we have enough data.
The expert chemist’s intuitive juggling between the universal and the particular must be made explicit so students can master graphing in chemistry. Consistent teacher-led modelling gives students power over graphs in chemistry and their relationship with chemical laws, by creating them as mathematical objects instead of pictures.
Emily Rose Seeber is a chemistry teacher


No comments yet