Teach pupils how to handle significant figures, decimal places and uncertainty in measurements

All measurements have uncertainty that comes from the limitations of measuring equipment and/or the variation in a sample. In this article, we focus on the uncertainty in an individual measurement rather than the statistical methods used to estimate variation between several measurements, eg range and standard deviation.
Rounding
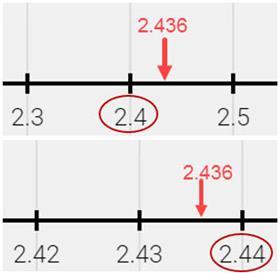
The way we express the result of a measurement or calculation conveys important information about our estimation of its accuracy. The underlying mathematics involves the concept of place value which is introduced early in primary school. All students will have covered rounding to the nearest whole number or to one, two or three decimal places (d.p.) by the age of 14. Using a number line helps students visualise and make sense of rounding. This approach may be needed for a few students in secondary. Less confident students tend to be more confident with whole numbers than decimals and it’s best to start with questions using rounding to whole numbers or tens before moving on to one decimal place and then two or three decimal places.

Students can move on from number lines to the following approach: underline the numbers to be kept, and then look at the digit after the last one to be kept and round up if it is 5 or more, otherwise round down.

Questions 1 and 2 in the resource (download below) are useful as a starter to remind students of what they have learned in maths and ensure they are secure with rounding before going on to significant figures.
Download this
A worksheet to provide extra support for students as MS Word or pdf, starting with number lines and gradually increasing the level of demand with choosing between options and filling in blanks (inspired by the blog of Don Steward and Jo Morgan’s resource), with the answers as MS Word or pdf.
Download this
A worksheet to provide extra support for students, starting with number lines and gradually increasing the level of demand with choosing between options and filling in blanks from the Education in Chemistry website: LINK
Significant figures
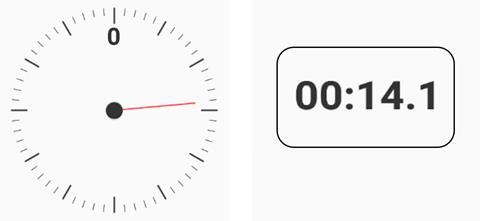
Students also learn about significant figures in maths and this is an area where close cooperation between maths and science departments is recommended. Expressing a measurement with a certain number of significant figures gives us information about the accuracy of the measurement. For example, say I made a measurement using my timer (see below).

If I read the dial, which is marked in seconds, I would report 14 seconds. However, using the digital display I would report 14.1 seconds. The digital measurement is more accurate as the reading has three significant figures, whereas the dial only has two significant figures.
Rules to work out the number of significant figures
- Zeros to the left of a number are ignored and the number of digits is counted from the first non-zero digit, eg 0.004 has one significant figure.
- Zeros in the middle of non-zero digits are significant: 407 and 0.00407 both have three significant figures.
- Zeros to the right of the first significant figure are significant: eg 0.00400 has three significant figures.
Bounds and error intervals
Students studying higher level maths at 14–16 will learn about the concept of upper and lower bounds. This may help them understand the importance and relevance of significant figures, but students might cover this after significant figures are introduced in science. The interval between the upper and lower bounds is known as the error interval.
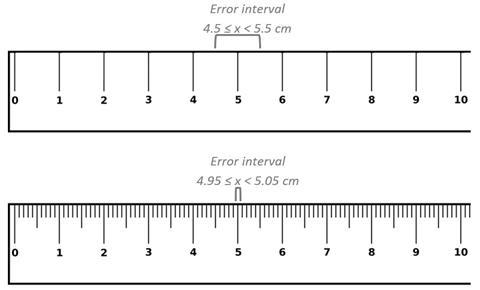
Take the example of the measurement of 5 cm to the nearest whole centimetre as shown in the upper ruler in the picture below. The actual measurement could have been anywhere between the lower bound of 4.5 and the upper bound of 5.5. In maths this would be written: 4.5 ≤ x < 5.5, since 4.5 would be rounded up to 5 and so is included in the error interval. However, 5.5 is not included in the error interval as it would be rounded up to 6 (it is also appropriate to use 5.49 or 5.49 recurring instead of 5.5). For the lower ruler where the intervals are marked in millimetres, the measurement is much more accurate and the error interval is smaller, 4.95 ≤ x < 5.05.

In science we can relate the concepts of bounds and error interval to that of significant figures. The significant figures carry meaning about the accuracy of the measurement and the error interval shows the uncertainty of the measurement. In science the uncertainty in the measurement is half the smallest scale division or, for a digital instrument, half the last figure shown on the display. Uncertainty can be expressed with the ± symbol so the error interval 4.5 ≤ x < 5.5 would be expressed as 5 ± 0.5.
Calculations using significant figures
Calculations using significant figures are where the maths and science approaches diverge the most. In maths, the calculation is performed using the lower bound of each measurement, then repeated using the upper bound of each measurement. The digits that are the same for the upper and lower bounds are reported. As a scientist, I find the GCSE maths approach distinctly odd and I reproduce the advice from Edexcel’s Guide to maths for scientists below:
To determine an appropriate level of accuracy for an answer to a calculation, you can find the upper and lower bounds of the calculation. Eg, if upper bound is 28.42896 and lower bound is 28.42712 then 28.42 is a suitable level of accuracy. NB, only Higher tier maths students learn this.
In contrast, in science where the calculation may involve several numbers, the number with the fewest significant figures determines the number of significant figures in the answer. Question 4 in the resource gives an example where there is minimal variation in the problems so that students focus on the significant figures rather than the calculation.
If there are several steps in a calculation, it’s important students use the full calculator display for any intermediate answers then report the final answer to the appropriate number of significant figures. If intermediate answers are rounded, then their final result may be incorrect due to rounding errors. Explain this distinction between the conventions in maths and science to your students so they are clear about the difference in approach.
Common confusion and misconceptions
Decimals vs significant figures
Students confuse decimal places and significant figures. They tend to think that if a measurement is made to many significant figures then it must always be more accurate. For example, use a tape measure marked in centimetres to make a small measurement, say 5 cm. Then use a tape measure marked in millimetres to make the same measurement. The measurement would be reported as 5 cm and 5.0 cm respectively. In the first case there’s one significant figure and in the second case there are two significant figures. A larger measurement using the same tape measures, say 164 cm, would be reported as 164 cm and 164.0 cm, respectively. So we have three and four significant figures respectively and we used the same equipment for the small and large measurements.
In the following multiple choice question the distractors include many common mistakes. Question 3 in the resource uses distractors based on these common mistakes.
Q3. Round 0.003865 to three significant figures.
a) 0.00 (just showing three digits)
b) 0.003 (to three decimal places with incorrect rounding)
c) 0.004 (to three decimal places with correct rounding)
d) 0.00386 (three significant figures but rounded incorrectly)
e) 0.00387 (the correct answer)
Zeros
Placeholder zeros in numbers such as 400 or 230 cause confusion because the zeros do not indicate significance. In science, the number 400 would be considered to have one significant figure, 230 would have two significant figures. In science these numbers should be converted to standard form so that the number of significant figures is shown unambiguously. Therefore, if the result of a calculation is 400 and there are three significant figures, it should be written 4.00 x 10².
Acceptable answers
What is considered an acceptable answer in maths and science can be different. If I measured 125.00 g of salt, rather than 125 g, a scientist would implicitly understand that I had used an accurate balance. In maths, students are told to consider whether their answers are practical, and they might assume that 125.00 is not practical.


No comments yet