


These strategies will help your students not only grasp abstract concepts but remember them too
We use images all the time in chemistry teaching: to explain abstract concepts, solve problems and show relationships. Used well, they can be highly effective to aid memory, develop understanding and support problem-solving.
Here are four evidence-informed strategies to make your images more effective in class.
1. Drawing for memory
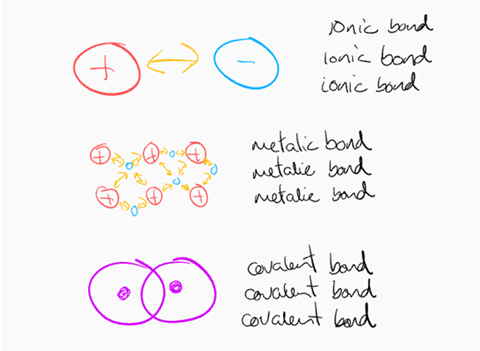
While your first impulse may be to get students to write down keywords, pictures are better than words. Get your students to sketch instead of writing. Drawing has a surprisingly powerful effect on memory. And the drawings don’t even need to be good! Give students scrap paper and encourage them to bin the sketches afterwards.
Asking students to sketch concepts will lead to improved memory. Don’t worry about quality, and don’t keep the drawings: it’s the process, not the product which makes the difference.
2. Teaching for understanding
Given that we use diagrams a lot in chemistry teaching, how should we use them? Should we label them, or explain them, give students time to work them out for themselves?
When you show your class an image, if the students are novices, they will benefit from an explanation. With expert students, an explanation will get in the way. Either approach works for intermediate learners. If it’s relatively new content, explain the image. If it’s revision, let them work it out.
But what form should your explanation take? Verbal is better than written labels, and definitely don’t use bothat the same time. If you want students to review their notes weeks or months later, I recommend first explaining verbally without labels then adding labels.
If attention is split between separate text and an image, retrieval is reduced. This is the split-attention effect. Ideally use the dual-coding approach and label the image directly.
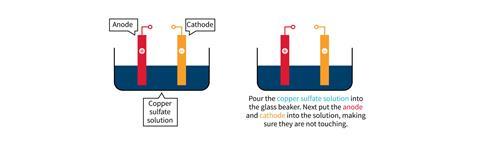
Even though labelling is more effective, you can’t always get the full explanation in a label. Sometimes you just have to have a text and diagram separately.
3. Sketching for problem solving
Chemists love a lightning sketch to help them solve problems – back of the envelope type drawings. They help reduce the cognitive load of a problem. However students are often reluctant to use them.
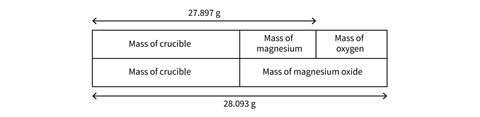
In problem solving, diagrams are more computationally efficient than text. That means diagrams put less demand on working memory, they are easier to scan for information and they show the problem-solver how the elements are arranged. As working memory is a limited resource, diagrams leave more capacity for solving the problem.
For example, compare this text to the visual representation below. They both contain the information needed to solve the problem, but the visual representation makes the problem easier.
4. Organising knowledge visually
If you have a knowledge-rich curriculum (and I think most science curriculums are), you run the risk of teaching a bunch of facts without the relevant relationships. Graphic organisers are a great way of showing students how knowledge is related.
Similar/different organisers are great for comparisons. They help students identify similarities and differences between two concepts. You could use each column as a paragraph, or for longer texts, use each box for a paragraph.
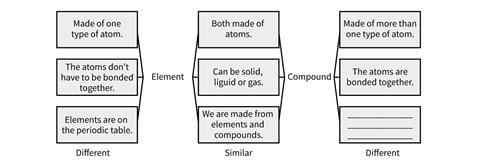
You can simply show your students similar/different organisers, but they are even more powerful used as retrieval exercises. Try them as a solo-pair-share activity. First give each student two minutes to fill in their own organiser (retrieval), while you circulate and check. Then give them a minute to compare with their neighbours. While you’re circulating, select useful responses (either strong ones or those with misconceptions you want to address). The final stage is to use these in the share phase. I always keep a completed organiser in my pocket, because they can be hard to do on the fly.
Cause and effect diagrams are useful for identifying and explaining multiple causes of an effect, for example climate change. You can use each set of ribs as a paragraph. To keep the causes separate but flowing into the effect, use a Fishbone or Ishikawa diagram, with a rib for each cause, all leading to one effect.
![]()
Exploded flow diagrams are great for sequences and processes which require detail at each stage. The smaller circles are for detail, the larger circles are for the main stages. You could use each stage as a separate paragraph of text.
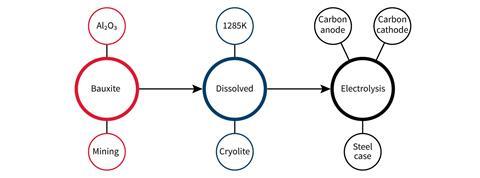
Be wary of adding too many stages, which could result in cognitive overload. If you can batch several stages together, you allow the students to search each batch separately, while maintaining a clear overview of the whole process.
Putting it into practice
You are probably already using a lot of visuals in your teaching. Perhaps you are about to introduce more. Either way, pay attention to how you use them.
Be efficient. Don’t speak when your students are reading. Try to reduce split attention by using labels, rather than a text with a key. When learners are experts, let them work out the diagram for themselves. And, finally, get your students drawing.
References
M A Fernandes, J D Wammes and M E Meade, Curr. Dir. Psychol. Sci., 2018, DOI: 10.1177/0963721418755385
S Kalyuga, P Chandler and J Sweller, J. Educ. Psychol., 2000, 92, 126 (DOI: 10.1037/0022-0663.92.1.126)
R Moreno and R E Mayer, J. Educ. Psychol., 1999, 92, 358 (DOI: 10.1037/0022-0663.91.2.358)
J H Larkin and H A Simon, Cogn. Sci., 1987, DOI: 10.1111/j.1551-6708.1987.tb00863.x


No comments yet