Tom Husband explains how the behaviour of big crowds is easier to predict than small ones

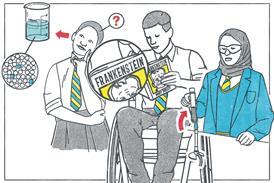
On average, school students spend 29 hours each week watching some form of electronic screen, such as laptops, televisions and mobile devices. But would you put big money on a particular student having spent exactly that amount of time in that way last week? Not a chance. It wouldn’t be a smart bet because people are like particles: we might be able to successfully predict how the crowd will behave, but not the individual.
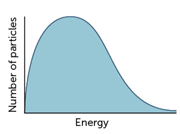
A survey of 1300 Canadian seventh graders actually found that 60% viewed screens for 20 hours in the surveyed week, 30% for 40 hours and 7% for 50 hours. If we put the data in a graph, something spooky happens. Going on the assumption that no teenagers spend no hours watching screens, the graph looks uncannily like a Maxwell–Boltzmann distribution.
Think about a container of gas. The Maxwell–Boltzmann curve models the distribution of energy between the particles. They will travel at different speeds, with different amounts of kinetic energy. In the graph, no particles have no energy, most particles have a moderate amount of energy and only a small proportion of particles have a lot of energy.
Measuring disorder
Imagine you throw three pound coins up in the air above three people. How do you think the coins would be distributed when they land? Would one person get all three coins leaving none for the rest? Would each person walk away with one coin? The most likely arrangement is actually that one person gets two coins, another gets one and the last person gets nothing. It could be one of them who gets the two coins, and in each case there is then a choice of two people to get the remaining coin, making the same distribution possible by six different combinations. Conversely, there is only one way in which they can each get one coin. As such, the 2,1,0 distribution has the highest probability. (There are three combinations for the 3,0,0 distribution.)
Entropy, often described as the measure of disorder, is calculated by applying the same calculation to the way that energy is distributed between particles. Working out the distribution with the highest probability can give incredibly accurate predictions about how a particular system will behave, but can only tell you what the crowd will do, not what the individual atoms will do. The smaller the crowd, the less accurate the predictions.
In the container of gas, everything can change in an instant. Speeding particle A might collide with dawdling particle B and transfer energy so that B emerges from the collision much faster than A. In an instant, A has slowed down and B has sped up.
Surfing or watching films?
It’s the same with teenagers and screen time. Any individual teenager is likely to spend a different amount of time viewing screens each week. They might have been surfing on a sunny holiday or whiling away rainy days watching films. Just like particle B got faster after colliding with A, so the same teenager might view screens for more hours one week compared with the previous. This data is no use for predicting how many hours a particular teenager watches screens in a particular week. But what it can tell us about the crowd of teenagers, as the researchers of a more recent study feared, is that most of them are exceeding the recommended daily limit of two hours per day. So if you are reading this online, it might be time to start reading The Mole in good old-fashioned paper format!

Find out more
Struggling to understand entropy? Find out how chance leads to predictability in chemical reactions with the Quantum Casino.
Struggling to understand entropy? Find out how chance leads to predictability in chemical reactions with the Quantum Casino (http://rsc.li/1N2ICER).
Originally published in The Mole


No comments yet