More than a quarter of the carbon dioxide we release by burning fossil fuels is absorbed by the ocean where it reduces ocean pH and alters seawater carbonate chemistry. If we do not act to reduce our carbon dioxide emissions, these changes in ocean chemistry could have a devastating impact on many shell-forming organisms, such as corals and some plankton, and marine ecosystems as a whole.
-
Projected ocean acidification over this century will be larger and more rapid than anything experienced by marine life for tens of millions of years
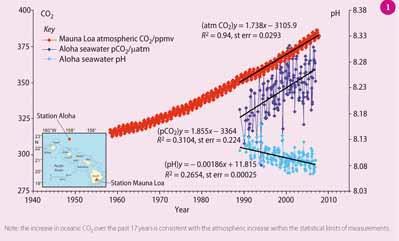
Current anthropogenic atmospheric carbon dioxide levels (386 ppm) - from transport, electricity generation and deforestation - are already more than 37 per cent greater than pre-industrial levels (~280 ppm). For example, the red line in Fig 1 shows atmospheric CO2 levels recorded since 1958 from the top of Mauna Loa volcano in Hawaii. A little less than half of the excess CO2 emitted by humans remains in the atmosphere. The remainder is removed by the ocean or land vegetation, which is beneficial because it slows the rate of global warming. However, recent evidence suggests that the ocean removal of CO2 has other serious consequences, namely ocean acidification.
Carbon dioxide in seawater
To understand ocean acidification, we need to consider briefly the thermodynamics of the inorganic carbon system in seawater.1 The partitioning of CO2 gas between surface air and water:
CO2(atmos) ⇋ CO2(aq) (i)
is temperature dependent. Once dissolved in seawater, CO2 gas reacts rapidly (seconds to a few minutes) to form carbonic acid:
CO2(aq) + H2O ⇋ H2CO3 (ii)
Carbonic acid quickly dissociates through the loss of hydrogen ions to form bicarbonate (HCO3-) and carbonate (CO32-) ions:
H2CO3 ⇋ H+ + HCO3-
H2CO3 ⇋ 2H+ + CO32- (iii)
Both the hydration reaction (ii) and acid-base reactions (iii) are reversible and near equilibrium. The total dissolved inorganic carbon (DIC) is the sum of CO2 (aq), H2 CO3, HCO3-, and CO32-.
Two other important parameters which define seawater thermodynamics are the pH:
pH = -log10[H+] (iv)
and the total alkalinity (AT):
AT = [HCO3-] + 2[CO32-] + [B(OH)4-] + [SiO(OH)3-] + [MgOH+] + 2[HPO42-] + 3[PO43-] - [H+] + [OH-] (v)
which is a measure of the acid-base balance of seawater. The positive terms in equation (v) are proton acceptors (bases formed from weak acids) relative to a reference point (formally acid dissociation pKa = 4.5, approximately the H2 CO3 equivalence point). Seawater alkalinity thus reflects the excess of proton acceptors, which can accept and neutralise the added acid, over proton donors. A related property is carbonate alkalinity (AC):
AC = [HCO3-] + 2[CO32-] (vi)
Chemical analysis
The amount of anthropogenic carbon in the ocean is relatively small - up to 30 parts in 1000. Thus monitoring any changes to this element requires high precision measurements of the order of ca one part in 1000. A particularly important advance has been the development of certified reference materials, ie batches of seawater with accurately known dissolved inorganic carbon and alkalinity values, that are used to calibrate instruments in different laboratories around the world to a common standard.
The DIC is measured by acidifying all of the inorganic carbon to CO2, stripping the CO2 gas out of the sample, and then measuring the CO2 gas using one of several analytical techniques such as infrared absorption, or coulometry (electrochemical titration).2 Seawater alkalinity is determined by acid titration, pH by spectrophotometric techniques with pH sensitive dyes, and carbon dioxide partial pressure (p CO2) by gas stripping and infrared absorption analysis.
The speciation of inorganic carbon and the complete state of the seawater carbonate system can be determined from temperature, salinity, and any two of four inorganic carbonate parameters: ie DIC, AT, pH, and p CO2. For typical surface seawater with a pH of 8.1, approximately 90 per cent of the total dissolved inorganic carbon is HCO3-, 9 per cent CO32-, and only 1 per cent CO2 (aq) (H2 CO3 is at trace levels).
The inorganic carbonate system is the dominant buffer for seawater acid-base chemistry. Thus adding CO2 to seawater increases CO2 (aq), HCO3-, and H+ ion concentrations, the latter lowering pH. Somewhat counter-intuitively, the concentration of CO32- declines, however, because of the increasing H+ concentration.
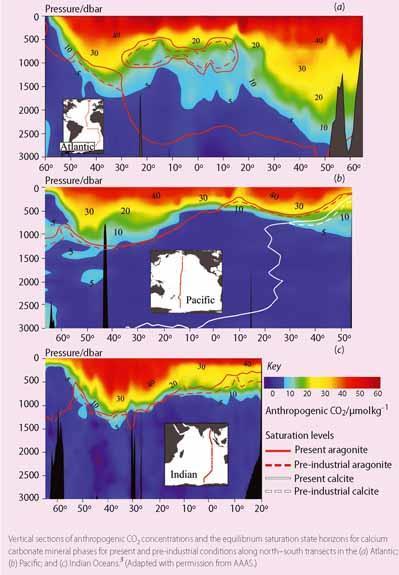
Based on an extensive global ocean survey in the 1990s, oceanographers have mapped the distribution of anthropogenic carbon in the ocean. The highest levels are found in the upper half kilometre of the ocean near the ocean-atmosphere interface, and in the northern North Atlantic and around Antarctica where cold, dense waters sink to the deep ocean (Fig 2). Using these data and numerical models, scientists estimate that the surface pH of the ocean has dropped by 0.1 pH unit since pre-industrial times, which is equivalent to a 30 per cent increase in the H+ concentration. The light blue line in Fig 1 shows the change in surface water pH off Hawaii measured over the past 20 years.
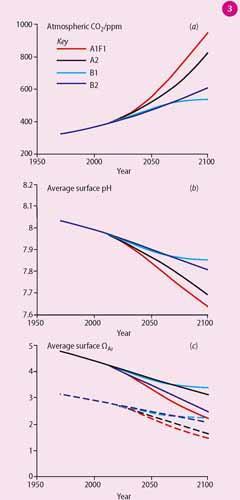
Research summarised by the Intergovernmental Panel on Climate Change (IPCC) predicts that fossil fuel CO2 emissions will increase at least during the middle of the 21st century, resulting in atmospheric CO2 levels ranging from 550 ppmv to 950 ppmv by 2100 (Fig 3 (a)). The surface pH of the ocean is projected to drop another 0.3-0.4 pH units from its pre-industrial values over the 21st century if fossil fuel CO2 emissions continue as expected (Fig 3 (b)), which will be equivalent to a further 150 per cent increase in H+ and a 50 per cent decrease in CO32- concentrations.3,4
Marine calcification
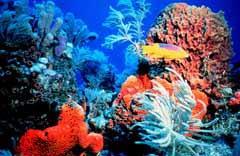
Much of the ocean acidification research to date has looked at the effects of elevated CO2 and reduced pH on those organisms that form calcium carbonate (CaCO3) shells and skeletons, such as corals, molluscs, and coralline algae.
The solubility of solid CaCO3 minerals is often expressed using the CaCO3saturation state (Ω), which is defined as the ion product of calcium and carbonate ion concentrations divided by the solubility product:
Ω= [Ca2+] [CO32-] /K´sp (vii)
The solubility product (Ksp) accounts for the activities of calcium and carbonate ions and depends on temperature, salinity, pressure, and the particular mineral phase, ie aragonite, calcite or magnesium calcite. (The aragonite and magnesium calcite are significantly more soluble than calcite.)
Seawater is 'supersaturated' with respect to CaCO3 when Ω>1.0 and 'undersaturated' when Ω<1.0. Mineral will dissolve in undersaturated conditions but rarely in supersaturated conditions. Since [Ca2+] is closely proportional to salinity in the ocean, Ω is largely determined by variations in seawater [CO32-]. As a rough approximation the carbonate concentration is:
[CO32-] = [AC] - [DIC]
There are large geographic variations in carbonate saturation states, influenced by spatial gradients in both [CO32-] and K´sp. The values of Ω are highest in shallow, warm tropical waters and lowest in cold, high-latitude regions and at depth. These patterns reflect the increase in CaCO3 saturation state with increasing temperature and decreasing pressure as well as the contribution of organic matter respiration and CO2 release in subsurface waters.
The aragonite and calcite saturation horizons are defined as the depth where Ω is equal to one for a particular mineral. The saturation horizon is the boundary between supersaturated conditions above this depth and undersaturated conditions below, ie the level below which carbonate minerals begin to dissolve.
The saturation horizons are deepest in the northern North Atlantic because of recent deepwater formation and shallower in the Indian and Pacific Oceans because of cumulative dissolved inorganic carbon enrichment caused by respiration of sinking organic matter along the deepwater circulation pathways (Fig 2).
Ocean acidification acts to move carbonate saturation horizons toward the surface. The most sensitive areas are likely to be the surface subpolar North Pacific, Arctic Ocean, Southern Ocean, and at mid-depth along the Pacific continental shelf.4,5 Surface water carbonate saturation is predicted to decline during the 21st century (Fig 3 (c)).
Studies in the lab and at sea
Much of our knowledge about biological acidification effects comes from laboratory incubation experiments where organisms are grown in small aquarium under elevated CO2 conditions (or lower pH) for periods of a few days to months.6
Organism growth, calcification rate and health are compared against those of organisms from control experiments that are identical in all ways except for seawater chemistry. Such studies indicate that calcification rates for some species, in particular corals and some molluscs, are quite sensitive to declines in carbonate saturation state even when the seawater is supersaturated. For tropical corals, calcification rates may decline to near zero when atmospheric CO2 reaches roughly 500 ppm, which could occur by the middle of this century.7
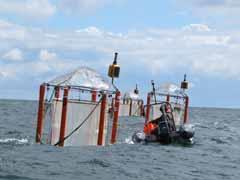
Similar CO2 experiments can be done on large volumes of seawater, several thousand litres, in mesocosms (either large tanks or plastic bags suspended in the water). The advantage of a mesocosm is that it can capture the behaviour of the interconnecting food chains, at least for planktonic or water-column ecosystems where the dominant species - bacteria, phytoplankton and zooplankton - are relatively small.
Plans are underway to do the same experiment for seabed ecosystems such as coral reefs, but this will require substantial engineering to enclose a portion of a reef or to maintain elevated seawater CO2 levels above a reef in an open system.
Biological consequences
Many ocean microbes, plants and animals will be affected by ocean acidification either directly from changes in seawater chemistry (lower pH, elevated CO2 (aq), and reduced CO32-) or indirectly through changes to interconnected food chains.6-8
The magnitude and even the sign of biological responses, however, will vary substantially from one species to another. By decreasing the CaCO3 saturation state, ocean acidification may reduce shell and skeleton growth by a wide range of calcifying marine organisms from plankton to seabed-dwelling molluscs, echinoderms (starfish, sea urchins, sea cucumbers etc) and corals. Tropical corals are the backdrop for rich and diverse reef environments, and many fish species would disappear along with the corals.
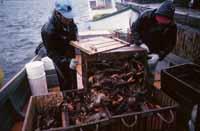
Crustaceans such as shrimp, lobsters and crabs also may be susceptible because their shells are a composite of chitin, proteins, and carbonate minerals. These are important sources of seafood. For example, about half the income for marine fisheries in the US comes from molluscs and crustaceans. Less familiar are the many shell-forming planktonic organisms, including plants like coccolithophores and marine snails called pteropods, which are an important food source for salmon and whales.
In contrast, some photosynthetic organisms (both calcifying and non-calcifying) exhibit higher growth rates under elevated CO2 (aq). Acidification also may alter seawater chemical speciation and biogeochemical cycles of many elements, with poorly understood consequences.7 For example, many trace metals in seawater are complexed largely with inorganic anions (eg OH- and CO32-) and organic ligands. Thus the bioavailability of essential trace metals, such as iron, and biotoxins, such as copper, may be sensitive to altered pH and reduced CO32- concentration. Ocean alkalinity and the ocean's capacity to take up more CO2 from the atmosphere will presumably increase because of reduced production and increased dissolution rates of CaCO3.
Prospects for the future
Unless there are dramatic changes in our fossil fuel use, projected human-driven ocean acidification during this century will be larger and more rapid than anything experienced by marine life for tens of millions of years. And the problem will be with us for a long time because it takes centuries to thousands of years for natural processes, primarily mixing into the deep-sea and increased dissolution of marine carbonate sediments, to remove excess carbon dioxide from the air.
Although there will be biological winners as well as biological losers, it is likely that the ocean of the future under high carbon dioxide levels will look quite different within the lifetimes of today's children if we continue on our current course. Although ocean pH has varied in the geological past, palaeo-events may be only imperfect analogues to current conditions. The potential for marine organisms to adapt to increasing CO2 is not well known nor are the broader implications for ocean ecosystems, which make both high priorities for future research.
What can be done?
So what can be done about ocean acidification? The obvious solution is to slow and eventually eliminate carbon emissions from burning fossil fuels and to develop approaches for removing carbon dioxide from the atmosphere. While there is no single panacea, a suite of promising technologies is emerging that focuses on increased energy efficiency, renewable energy such as wind, solar and biofuels, and carbon capture and sequestration, where carbon dioxide produced by power plants is pumped deep into the earth rather than being released to the atmosphere. We need to take action soon, however, to ensure the long-term health of the ocean, which we depend upon for fisheries, tourism, coastal protection and biodiversity.
Scott C. Doney is senior scientist in the department of marine chemistry and geochemistry at the Woods Hole Oceanographic Institution, 266 Woods Hole Road, Woods Hole, MA 02543, US 508-289-3776 (e-mail: sdoney@whoi.edu) and Richard A. Feely is a senior research scientist at National Oceanic and Atmospheric Administration, 7600 Sand Point Way NE, Seattle, WA 98115-6349, US 206-526-6214 (e-mail: Richard.A.Feely@noaa.gov).
Related Links
Earth System Research Laboratory
Trends in atomospheric carbon dioxide
References
1. R. E. Zeebe and D. Wolf-Gladrow, CO2 in seawater: equilibrium, kinetics, isotopes, pp 346. Amsterdam: Elsevier Science, 2001.
2. A. G. Dickson, C. L. Sabine and J. R. Christian (eds), Guide to best practices for ocean CO2 measurements. PICES Special Publication 2007, 3, 191.
3. R. A. Feely et al, Science, 2004, 305 (5682), 362.
4. J. C. Orr et al, Nature, 2005, 437, 681.
5. R. A. Feely et al, Science, 2008, 320, 1490.
6. V. J. Fabry et al, ICES J. Mar. Sci., 2008, 65, 414.
7. S. C. Doney et al, Ann. Rev. Mar. Sci., 2009, 1, 169.
8. S. C. Doney, F1000 Biology Reports, 2009, 1:36, 4.
9. Mauna Loa data: P. Tans, NOAA/ESRL
10. HOTS/Aloha data: D. Karl, University of Hawaii.




No comments yet