










Try these activities to identify your students’ mathematical misconceptions when presenting chemistry data. Use them in your teaching to help students interpret their practical observations using non-linear graphs.
Many of the graphs pre-16 chemistry students experience will be non-linear, as they show the progression of a reaction. Students must be able to relate the graph to what is happening during the experiment and then try to offer an explanation.
Example 1 - Changes of state
Working through this simple exercise and then encouraging the students to use their answer to ask each other questions will help them to consolidate their ideas and enable them to progress to writing full explanations.
Look at the graph below where ice is being heated from -10 °C to 110°C.
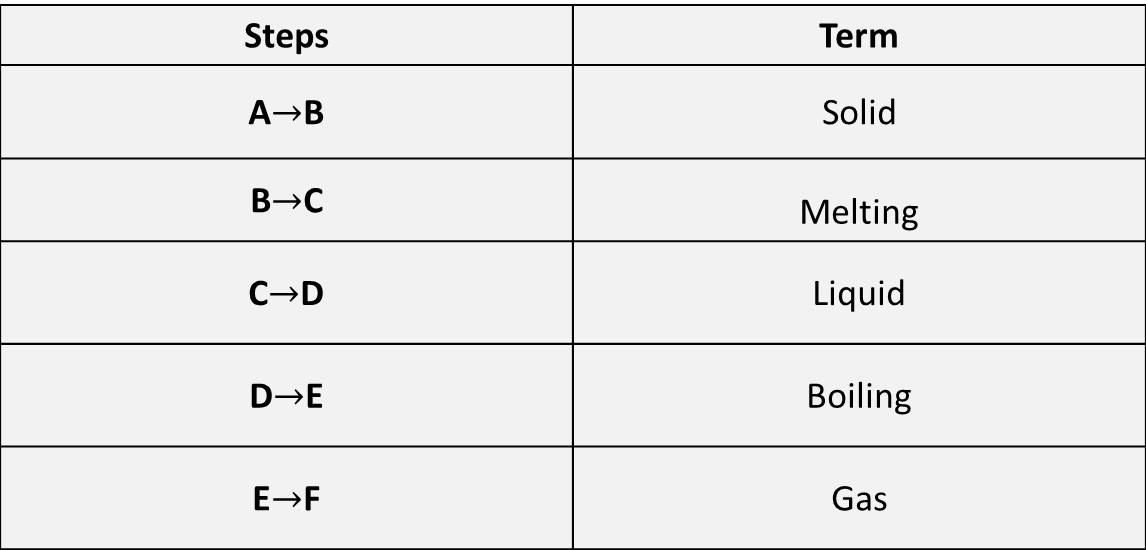
From the options below, choose a term that best describes the steps being shown from A→E.
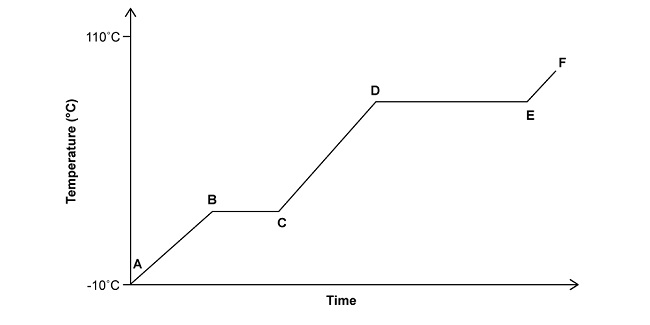

Once you have identified your answers, head to the bottom of this page for confirmation.
Example 2 - Rates of reaction
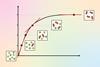
Understanding how the gradient of a non-linear graph changes will help students make links to what is happening in the reaction. Notice how the gradient of the graph changes during a typical chemical reaction such as that between marble chips and hydrochloric acid.
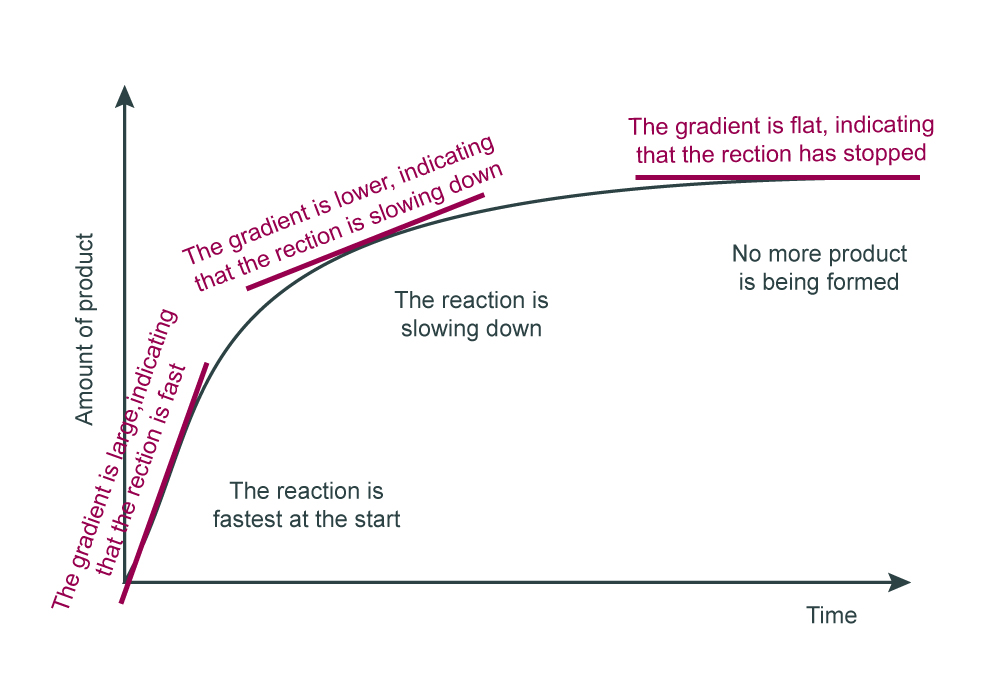
If students can appreciate what the gradient means, it will help them to work out what is happening in the reaction vessel.
Example 3 - Matching graphs
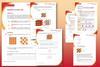
The matching graphs and statements activity is a useful activity to do with your students. Here the students must focus on the actual graphs as they use them to explain what story they tell.
Answers
Additional information
These examples originally appeared in an online CPD course developed by Dorothy Warren and Derek Denby.
Visit our Professional development for teachers page to view our current courses.



No comments yet