


Watch this
A demonstration of this experiment and download the technician notes from the Education in Chemistry website: rsc.li/3aOOWUv
Exploring heating or cooling curves, especially those involving changes of state, is a common secondary school science lesson. Younger students might be expected to identify the processes occurring and describe the motions of the particles at each stage, while older students may also need to make inferences about changes in the heat capacity of the substance and the scale of its enthalpies of fusion and vaporisation.
It’s fairly simple to acquire a cooling curve involving a solidification, and this forms the basis of a classic chemistry experiment – CLEAPSS members can find excellent guidance on choice of substance to investigate as well as safety tips in L195 section 12. In heating a solid rather than cooling a liquid, you can see two changes of state in one experiment. But, although textbooks are full of idealised heating curves, generating one can be a challenge.
It’s fairly simple to acquire a cooling curve involving a solidification, and this forms the basis of a classic chemistry experiment – CLEAPSS members can find excellent guidance on choice of substance to investigate as well as safety tips in L195 section 12 (bit.ly/3zluzsb). In heating a solid rather than cooling a liquid, you can see two changes of state in one experiment. But, although textbooks are full of idealised heating curves, generating one can be a challenge.
Ideally, this demonstration should:
- involve heating at constant power;
- reveal a plateau for both melting and boiling, where the duration for the latter process will be significantly longer;
- create a curve in which students might be able to spot a difference between the rate of heating for the solid and for the liquid; and
- take about 10 minutes to complete.
Ideally, this demonstration should: involve heating at constant power; reveal a plateau for both melting and boiling, where the duration for the latter process will be significantly longer; create a curve in which students might be able to spot a difference between the rate of heating for the solid and for the liquid; and take about 10 minutes to complete.
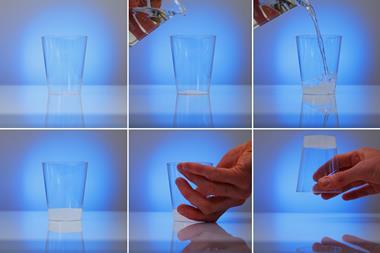
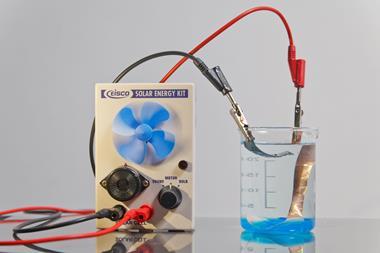
The substance 2-methylbutan-2-ol (tert-butanol) is an excellent choice to meet the above criteria as it is a solid at room temperature but boils at 83°C, so there’s a short time between melting and boiling, and water baths can be used for heating. I was inspired by Bob Worley’s demonstration of rapid phase changes in small quantities of the alcohol by dipping a small amount in an ice bath and freshly boiled water.
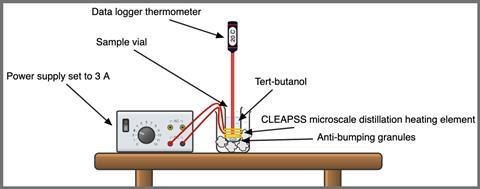
Although you could use a water bath for heating (see alternative method below), I’ve chosen to work with a version of the CLEAPSS microscale distillation apparatus (see guide GL254). This can heat the alcohol at constant power, and the form factor of the sample vial avoids problems with data logger probes that don’t reach the bottom of test tubes.
The substance 2-methylbutan-2-ol (tert-butanol) is an excellent choice to meet the above criteria as it is a solid at room temperature but boils at 83°C, so there’s a short time between melting and boiling, and water baths can be used for heating. Although you could use a water bath for heating (for an alternative method, see rsc.li/3aOOWUv), I’ve chosen to work with a version of the CLEAPSS microscale distillation apparatus (see guide GL254 – bit.ly/3Q8MZ5l). This can heat the alcohol at constant power, and the form factor of the sample vial avoids problems with data logger probes that don’t reach the bottom of test tubes.
Kit
- CLEAPSS microscale distillation apparatus (see guide GL254)
- Low voltage power supply (capable of supplying 5 A)
- tert-butanol (harmful by inhalation, irritant to eyes and respiratory system, highly flammable), approx 20 ml
- Cotton wool
- Data logger and thermometer
- Wires and crocodile clips
- Clamp and stand
- Visualiser / bench cam
- Resealable sandwich bag
- Eye protection
Preparation
Although the CLEAPSS microscale heating element suggests the use of a 7 cm3 ‘Bijou bottle’, we built ours using the ~30 cm3 sample vials in our department and found them highly adaptable (see accompanying video for clarification).
Work with a fresh sample of the alcohol each time as, over multiple cycles, the alcohol picks up moisture and melts over an increasingly wide range. Ensure you don’t attempt to heat the alcohol with a naked flame.
One obstacle to obtaining a clean melting profile is the solid sticking to the thermometer while being surrounded with liquid that can climb significantly above the melting temperature before the last of the solid slides off the probe. You could use crushed solid to avoid this, and setting up is much faster because you don’t need to freeze the probe in place in the middle of the liquid. The melting point of tert-butanol is around 26°C so it will probably be solidified in the store cupboard. Place the bottle in a plastic bag (to protect the label) and leave the bottle in lukewarm water with the lid slightly loosened to melt the outside, and fill approximately two thirds of the sample vial (~15–20 cm3).
Pour the liquid into a resealable sandwich bag and leave in the freezer. Add a few anti-bumping granules to the remains of the alcohol in the sample vial and put it in the fridge with the heating element.
Within minutes, the alcohol will have frozen in the bag and can be easily broken into a fine powder by crushing the bag in your hand. Working with powdered solid rather than one large frozen lump means you can stir the solid as it melts, and large pieces won’t get stuck to the thermometer. You can then load the solid into the sample vial (a wide-necked funnel or a weighing boat can help deliver the solid neatly) and leave the vial, heating element and thermometer in the fridge until you begin the demonstration.
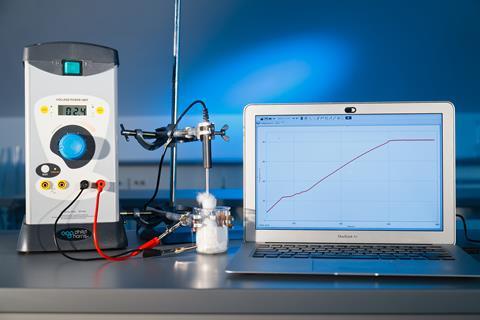
Set up a 5 A delivery classroom power supply, the data logger (allowing for 1000 seconds of collection) and a clamp stand for the thermometer.
In front of the class
Ensure the room is well ventilated. Take the loaded vial and heating element from the fridge, loosely clamp the thermometer over and wait for the temperature reading to stabilise before starting data collection. Turn on the power supply to deliver 3–4 A (DC). Loosen the clamp and stir the powder with the end of the probe for even heating.
At around 23°C, the solid will melt and, from this point, you can clamp the thermometer in the liquid and add a small amount of cotton wool around the rim to minimise vapour loss to the room. After a few minutes of increasing temperature, the liquid will start to boil (approx 83°C) and the temperature will plateau. Leave boiling for long enough to establish that this part of the heating curve will continue for a substantially longer time than the melting required.
Alternative methods
You could also heat a medium-sized test tube of powdered alcohol in cold tap water on a hot plate, but the demonstration will be longer because of the larger thermal mass – it’s difficult to heat at constant power without stirring the water as well as the alcohol (although you may have a heater–stirrer available). Placing the tube directly into freshly boiled water demonstrates both changes of state rapidly, but the solid melts so fast there’s little chance of seeing the corresponding plateau in temperature.
Teaching goal
The goal here is to demonstrate how raising the internal energy of the substance can lead to changes in the kinetic energy of its particles (reflected in its temperature) or in their potential energy (reflected in the change of state).
As melting leads to a relatively small change in particle separation compared to vaporisation, the latter process should take longer when heating under constant power. For tert-butanol ∆Hfus is approx 7 kJ mol-1 whereas ∆Hvap is approx 40 kJ mol-1 (see NIST Chemistry WebBook).
The average slope when heating the solid should be significantly steeper than for the liquid because the heat capacity of the solid is lower (146 J K-1 mol-1) than the liquid (215 J K-1 mol-1). Although students probably won’t have encountered entropy when looking at cooling or heating curves, you could point to the similarity in the units and explain the greater heat capacity due to the additional ways the liquid can store energy through moving with its particles freed from the constraints of the solid.
Older students might be curious about the relationship between the structure and bonding in the substance and the melting and boiling points. For highly symmetrical molecules like this branched isomer of butanol, very ordered crystals with high melting points can form, but the boiling points will be suppressed when compared with the more linear isomers as surface area for contact is lower, inhibiting London forces.
Declan Fleming
Downloads
Demonstrating the heating curve of tert-butanol technician notes
PDF, Size 0.15 mbDemonstrating the heating curve of tert-butanol technician notes
Word, Size 0.43 mb


No comments yet