Build confidence and understanding step by step with rates of reactions for 14–16 learners
’Do it again!’ ’Can you make it hit the ceiling?’ When learners watch the elephant’s toothpaste demonstration, holding their interest in rates of reaction can feel easy. Talking to leaners about avoiding explosions can also be popular, such as how the gas-releasing reaction in an airbag must occur in less than 0.05 seconds – very fast, yes, but still controlled. But learners need to stand with a stopwatch, complete a results table, plot a graph and explain its curve. Then engagement can become the victim of conceptual difficulties.
What students need to know
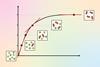
Learners at 14–16 will be familiar with straight-line graphs that show steady change over time, but rate of reaction experiments introduce more complex curves in which the rate itself changes.
At 14–16, students need to know:
- The average rate of a reaction can be calculated from the change in quantity of product or reactant divided by the time taken.
- The change in quantity can be measured by monitoring the loss of mass as gaseous products escape or the change in volume as gaseous products are collected.
- Graphs that show the quantity of product formed or quantity of reactant used up against time can be used to show changes in rate as a reaction progresses.
- Some 14–16 qualifications require students to calculate, and distinguish between, both the average rate over an interval and the instantaneous rate represented by the gradient at a single point.

What you need to know
Learners at 14–16 are taught that increasing the concentration of a reactant increases the frequency of collisions and hence the rate of reaction. Post-16, the model is refined so students can understand rate equations and orders of reactions, and grasp that the rate of reaction can be independent of the concentration of a reactant if it is not involved in the rate determining step.
Quantitative information about the reaction, such as the rate equation or activation energy, becomes important post-16. That means the graphs change too. Whereas graphs at 14–16 most commonly plot experimental data of changes in quantity of a product or reactant against time, post-16 students often plot graphs of the calculated rate against a variable, such as concentration or temperature. Help prepare students for this by emphasising what measurements and graphs represent physically, rather than relying on easy-to-remember rules. Simple endpoint methods, such as the disappearing cross experiment, provide a bridge between qualitative descriptions of collision frequency and later quantitative calculations of rate.
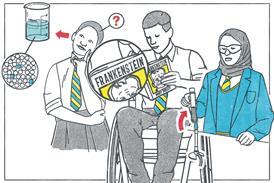
When ideas of activation energy, orientation and reaction mechanisms are introduced at post-16, it becomes clear that collision theory is a simplified model. At at 14–16 and post-16 emphasise how collision theory is a model that cannot explain everything in the same way that a Lego structure of a famous tower cannot capture every detail.
Misconceptions
When it comes to explaining and understanding graphs, students often try to use easy-to-remember but inaccurate rules. Some will think graphs flatten off because the reactants have ‘disappeared’ and there is ′nothing left’. Meanwhile an upward sloping graph might become synonymous with faster, which incorrectly leads learners to think the reaction rate is increasing if the graph continues to rise, regardless of the slope.

Address these misconceptions by challenging learners to explain the graphs. What is actually being measured and how does that relate to the rate of reaction? How much product is there at each stage? Which part of the graph shows the biggest increase in product in the shortest time?
Learners tend to enjoy finding other people’s mistakes, so show them two curves and an incorrect statement, for example that one line represents a faster reaction because it produces more product. Ask if they agree. Then ask them to correct the statement or draw a curve that would match the statement.

Suggestions for teaching
The first step towards understanding rates of reaction graphs is to carry out the experiment and record measurements at regular intervals. This can be tricky for many learners because of the considerable organisational skills required to observe, write down measurements and keep track of time simultaneously. Working in groups of three can help: give one student the task of calling out time from the stopwatch, one reading the measurement and one writing it down. Challenge the learners to see how reliable their results are when they repeat the experiments.
Allow plenty of time and opportunities to plot and understand the resulting graphs. You might even start with plotting a model data set so everyone can discuss the same graph. In maths lessons, graphs are often used to illustrate idealised mathematical relationships rather than experimental data. That means even choosing an appropriate scale can be more challenging in chemistry lessons. In teaching rates of reaction, graphs are the bridge that connects experimental measurements and observations to both collision theory and quantitative calculations. Once plotted, there is no rush to get to the calculations. Give students time to interpret the curves, first in terms of the relative rate of reaction at different points, and then in terms of collision theory.
Once learners can accurately explain what different parts of a graph represent and compare tangents qualitatively by using terms such as faster and slower, you can add in the calculations. Then ask them to relate the numbers back to collision theory and to the shape of the curve. It might not be as exciting as watching elephant’s toothpaste, but making sense of rates graphs across multiple levels of understanding can be just as satisfying.
Resources for your classroom
- Revisit collision theory with students by using the approaches outlined in Teaching rates of reaction and collision theory at 14–16.
- Ensure leaners are confident that matter is not created or destroyed with two microscale experiments, only one of which will result in a change in mass.
- Explain rates of reaction through colour change with the disappearing cross practical.
- Help students distinguish rate from time, and the average rate over time from the rate at one instant with this set of worksheets from BEST.
- Ensure students see graphs as more than just pictures and representations in How to approach graphs in chemistry.


No comments yet