


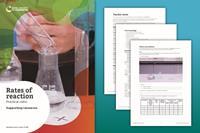
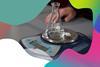
Observe how the concentration of sodium thiosulfate solution affects its rate of reaction with hydrochloric acid
The value of experiencing live practical work cannot be overstated. Numerous studies provide evidence of its value in terms of learner engagement, understanding, results and the likelihood of continuing to study chemistry or work in a related field.
Use this video to complement live practical work, or to help learners understand the methods, equipment and skills when they cannot access the lab.
Chapter titles: 00:09 Introduction to rates of reaction; 01:34 Carrying out the experiment; 05:45 Calculations; 07:40 Evaluating the method.
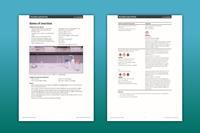
Teacher notes
Full teacher notes are available in the supporting resources booklet (also available in MS Word), including ideas for how to use this video and the accompanying activites and answers to use as part of your teaching.
-
-
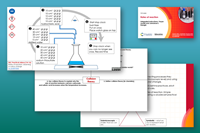
Learner slides
Integrated instructions, Frayer model and Johnstone's triangle
Download as: MS PowerPoint -
Notes on running the practical experiments
Ask learners to work in pairs. Demonstrate how to set up the equipment first (either in-person or via the video) to emphasise health and safety issues. Remind learners that they must wear eye protection and direct them to the relevant student safety sheets (SSS).
It is important that all learners have access to a stop bath to dispose of their waste products as sodium thiosulfate solution (SSS034) reacts with hydrochloric acid (SSS020) to toxic produce sulfur dioxide gas. Explain that the stop bath is a solution of sodium carbonate/hydrogen carbonate (SSS033) with an acid–base indicator such as phenolphthalein (SSS070). It neutralises any remaining acid and the sulfur dioxide reacts with the water to produce sulfuric acid. If the indicator is showing the acidic colour, refresh the stop bath by adding more sodium carbonate solution. Ensure the room is well ventilated. A microscale version of the experiment is available from CLEAPSS.
Teaching rates of reaction at 16–18 too? Watch the practical video to show learners how to monitor the rate of reaction and identify the effects of changing temperature and concentration, using both initial rate and continuous monitoring methods. Plus, download the resources for teacher and technician notes, follow-up worksheets and more.
Health, safety and technical notes
Read our standard health and safety guidance and carry out a risk assessment before running any live practical. Refer to SSERC/CLEAPSS Hazcards, recipe books and student safety sheets. Hazard classification may vary depending on supplier. Download the technician notes for the full equipment list, safety notes and disposal information.
Procedure
-
Measure 10 cm3 of sodium thiosulfate and pour it into the conical flask.
-
Measure 40 cm3 of distilled water and add it to the conical flask.
-
Place the flask on the black cross.
-
Using a clean measuring cylinder, measure 10 cm3 of hydrochloric acid.
-
Add the acid to the flask, start the stop clock and swirl.
-
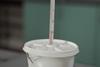
Place the watch glass on top of the flask to limit breathing in sulfur dioxide gas.
-
Time how long it takes until you can no longer see the black cross. Look at the cross from a distance of at least 20 cm above the top of the flask.
-
Repeat the method using 20, 30, 40 and 50 cm3 of sodium thiosulfate solution with 30, 20, 10 and 0 cm3 of distilled water.
Find the integrated instructions for this experiment in the PowerPoint slides.
Real-world contexts
- Highlight the importance of understanding rates of reaction to avoid dust explosions in food production, such as flour mills. Demonstrate how surface area affects rate with the Exhibition chemistry video Powder power.
- Link to careers, such as Misbah’s role as a senior principal scientist. She is a computational chemist and predicts which catalysts will be best at removing harmful pollutants from vehicles.
- Read this CPD article for rates of reaction teaching tips and contexts, such as fighting infections, alcohol metabolism and more.
Key terms
Learners will need to have a clear understanding of the following scientific terminology:
- Rate of reaction – the change in the concentration of the reactant or product per unit time.
- Chemical change – a change in which one or more new substances are formed.
- Reactant – a starting substance in a chemical reaction.
- Product – a substance made during a chemical reaction.
- Mass – a measure of the amount of matter in a substance.
- Precipitate – an insoluble solid that forms when two solutions react.
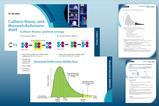
- Collision theory – for a chemical reaction to occur, two or more particles must collide in the correct orientation (the right way around) and with enough energy to break the bonds.
- Activation energy – the minimum amount of energy required for a reaction to occur.
- Temperature – a measure of how hot or cold an object is.
- Concentration – the mass of solute dissolved in a fixed volume of solvent.
- Pressure – the force per unit area.
- Catalyst – a substance that changes the rate of reaction without ‘taking part’ in the reaction.
- Surface area – the area of a solid chemical substance used in a chemical reaction.
- Volume – a measure of the amount of liquid.
You will find a template, example Frayer model and suggested answers for the term ‘collision theory’ in the PowerPoint slides. Find more examples and tips on how to use Frayer models in your teaching.
More resources
- Investigate the volume of hydrogen gas produced when magnesium reacts with hydrochloric acid.
- Use the Sustainability in chemistry resource on Catalysts and reaction conditions for sustainable industry to give your learners an authentic insight into how scientists work. Plus, download the research and presentation activity.
- Practise Interpreting rates of reaction graphs with your 14–16 year-old learners with this lesson plan and student worksheets.
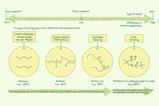
Common misconceptions
Difficulties related to chemical change
- Misconception: if you can’t see it, it has disappeared or was never there. Avoid using language surrounding chemical change that confuses learners, eg in this practical try to avoid the phrase ‘the cross has disappeared’ instead use the phrase ‘you can no longer see the cross’.
- Misconception: all reactions are driven by two reactants. Demonstrate reactions with more and less, eg decomposition, than two reactants.
- Misconception: all reactants equally influence how fast a reaction proceeds. Introduce limiting reactants.
Application of collision theory
Learners can struggle to form a full answer including:
- How the changing variable affects the reactants’ behaviours/properties.
- How this relates to collision theory.
- The concept of rate (per unit of time).
There is a lot going on here, so it is important to provide a clear scaffold for learners. Initially, the use of a structure strip (see the example and suggested answer in the supporting resources) will help, followed by plenty of practice providing learners with similar but slightly different questions.
Catalysts
There are several misconceptions around the understanding of catalysts including:
- Catalysts ‘are not involved’ in chemical reactions.
- Catalysts break chemical bonds.
- Catalysts increase the yield of the product.
- Catalysts only affect the rate of the forward reaction.
Be careful with your language. The definition in some pre-16 specifications eg ‘catalysts change the rate of reaction but are not used up during the reaction’ can lead to misconceptions if the definition is not carefully unpacked and linked to the reaction profile, showing an alternative reaction pathway with a lower activating energy. This 5-minute demonstration clearly shows the catalyst is involved in the reactions as the colour changes from pink to green and back to pink.
Cross-curriculum links and skills
This practical activity provides the opportunity to develop several ‘working scientifically’ skills and mathematical skills including:
- Following instructions to carry out experimental techniques or procedures.
- Identifying and controlling significant quantitative variables where applicable, and planning approaches to take account of variables that you cannot readily control.
- Accurately measuring quantities and recording observations.
- Drawing a graph with a line/curve of best fit.
- Calculating the gradient of a graph by drawing a tangent to the curve.
- Using the correct units and levels of accuracy when carrying out chemical calculations.
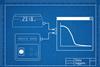
Graphs
If asked to draw another line on a graph (eg, volume of gas produced (y-axis) versus time (x-axis)) learners can struggle to know how to draw it. Should the start go up more steeply? Where does it plateau? Encourage learners to tell the story of their graph. Linking what is happening in the reaction vessel and their observations to what the graph is showing. Using a Johnstone’s triangle approach can also help here. Download the PowerPoint slides for an example and suggested answers.
Drawing a tangent to a graph
Many learners find this challenging and depending on when you teach rates, they may be meeting the concept for the first time. Talk to your maths colleagues to find out when they teach tangents.
Downloads
Rates of reaction supporting resources
Handout | PDF, Size 1.16 mbRates of reaction technician notes
Handout | PDF, Size 0.53 mbRates of reaction slides
Editable handout | PowerPoint, Size 0.34 mbRates of reaction supporting resources
Editable handout | Word, Size 0.99 mb
Additional information
The original video script, supporting resources and slides were written by Dorothy Warren. The technician notes were adapted by Sandrine Bouchelkia.


Practical videos | 14–16 years
- 1
- 2
- 3
 Currently reading
Rates of reaction
- 4
- 5
- 6
- 7
- 8
- 9
- 10
- 11
- 12
- 13
- 14


No comments yet