Maxwell–Boltzmann curves are a great opportunity to recap collision theory and further learners’ understanding of reaction rates
This resource accompanies the article How to teach Maxwell–Boltzmann distribution curves in Education in Chemistry where you can find guidance and teaching strategies, including common misconceptions.
Learning objectives
- Understand reaction kinetics in terms of collision theory and energy profile diagrams.
- Draw and interpret Maxwell–Boltzmann distribution curves.
- Use Maxwell–Boltzmann distribution to explain how a change in temperature affects the rate of reaction.
- Use Maxwell–Boltzmann distribution to help explain the action of a catalyst on reaction rate.
Use as a revision resource or to bridge the gap between learning at 14–16 and post-16 courses, or to complement practical activities on these topics.
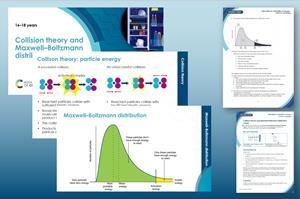
The first half of the presentation recaps the basics of collision theory and stimulate a class discussion about previous learning on rates of reaction. Slides 8–12 introduce Maxwell–Boltzmann (MB) distribution curves and show how the curves link to collision theory.
Scaffolding
Get learners to work through the questions on the student sheet independently or as a small group to offer peer support to each other.
More resources
- The problem-based practical activity A little gas asks learners to use a simulation to explore the behaviour of particles in an ideal gas, before writing a magazine article about computer simulations in education.
- Use the Rates of reaction practical video to help learners link practical observations to theory.
- Find more assessment questions for this topic in our Kinetics starter for ten.
- Introduce your learners to Misbah, a senior principle scientist who uses computers to predict which catalyst will be best at removing pollutants from vehicles.
Teaching sequence
1. The first part of the presentation recaps key points about collision theory and reaction kinetics. Initially, show learners the diagrams on slides 4 and 5 and ask them to describe what is shown in each diagram using appropriate terminology. Encourage ideas such as diatomic molecules, bonds breaking, atoms rearranging and formation of an intermediate.
2. Discuss the energy profile diagrams on slide 6. Ensure learners understand what each diagram represents:
- Start by drawing learners’ attention to axes labels.
- In the left-hand diagram, the reactants collide in the correct orientation with sufficient energy to react, so the activation energy is achieved, successful collisions occur and products are formed.
- In the right hand diagram, the reactants do not have sufficient energy to react, so the activation energy is not achieved, successful collisions do not occur and no products are formed.
3. Share the graph on slide 7, showing typical data from an investigation into the reaction of magnesium and acid. Use this slide to stimulate discussion about why the rate of reaction changes throughout the reaction. Within this discussion, remind learners about factors that can change the rate of reaction, including temperature, concentration, surface area, pressure and the addition of a catalyst.
To increase the level of challenge, ask learners to calculate and compare the rate of reaction at given points on the graph.
4. Use the simulation to introduce Maxwell–Boltzmann curves.
- Start with a low simulation speed – link this back to a low temperature.
- Observe the histogram and discuss the colour coding of the particles.
- Then increase the simulation speed – link to a higher temperature.
- Observe how the shape and colours of the histogram have changed.
- Emphasise that the number of particles are the same.
- Stress that we are looking at an energy distribution and not a process graph.

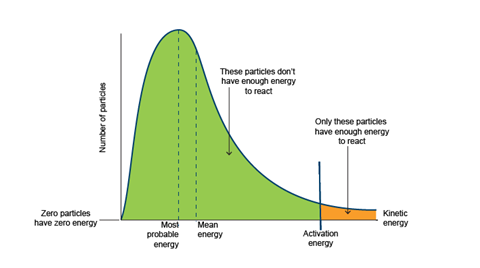
5. Highlight the key features of the Maxwell–Boltzmann distribution illustrated (slide 9).
- The area under the curve represents the total number of particles and so remains constant.
Going from lower energies to higher energies:
- Zero particles have zero energy.
- The most probable energy of a particle is shown by the maximum height on the curve.
- The mean energy of the particles present is different from the most probable energy. It is higher.
- The position of the activation energy is key. Only particles with kinetic energy equal to, or greater than, the activation energy have enough energy to react (indicated by the area shaded orange on the graph). All the remaining particles (indicated by the area shaded green on the graph) do not have enough kinetic energy to react.
6. Illustrate what happens to the Maxwell–Boltzmann distribution curve when temperature increases (slide 10).
7. Finally, show the effect of a catalyst on activation energy by showing the energy profile diagram on slide 11 and how that impacts the Maxwell–Boltzmann distribution curve on slide 12.
Answers
Answers to all questions on the student sheet are available in the teacher notes.
Downloads
Collision theory and MB curves slides
Presentation | PDF, Size 1.42 mbCollision theory and MB curves teacher notes
Handout | PDF, Size 0.36 mbCollision theory and MB curves student
Handout | PDF, Size 0.26 mbCollision theory and MB curves slides
Presentation | PowerPoint, Size 1.24 mbCollision theory and MB curves teacher notes
Editable handout | Word, Size 3.46 mbCollision theory and MB curves student
Editable handout | Word, Size 4.08 mb


No comments yet