


Get your learners working with qualitative graphs and watch their scientific understanding and reasoning increase

A qualitative graph shows how one variable is expected to change in relation to another, without plotting numerical data. The axes identify the variables, but a detailed numerical scale is not needed. What matters is the overall pattern: whether the line rises, falls, levels off, changes gradient or reaches a maximum or minimum. This apparent simplicity gives qualitative graphs considerable power.
Go beyond the data
Relying only on quantitative graphs risks narrowing your learners’ attention to the mechanics of plotting, rather than the science the data represents. Qualitative graphs make them commit to a relationship – the obstacle is interpretation, not mathematical competence. A learner may say, ‘increasing temperature increases the rate of reaction’, but what do they think the graph should look like? Should it be a straight line? Does it continue rising indefinitely? Where should it begin? Sketching the relationship reveals a learner’s scientific thinking in a way a short verbal answer does not.
Relying only on quantitative graphs risks narrowing your learners’ attention to the mechanics of plotting, rather than the science the data represents (bit.ly/4iT0B5d). Qualitative graphs make them commit to a relationship – the obstacle is interpretation, not mathematical competence. A learner may say, ‘increasing temperature increases the rate of reaction’, but what do they think the graph should look like? Should it be a straight line? Does it continue rising indefinitely? Where should it begin? Sketching the relationship reveals a learner’s scientific thinking in a way a short verbal answer does not.
Qualitative graphs provide an important bridge between seeing what happens, describing the pattern and explaining why it has that shape. A qualitative approach enables students to go beyond the data, make inferences, view the graph as a whole and integrate conceptual and representational understanding.
More maths
Discover resources, articles, activities and ideas to help you teach graphs in science in our maths skills for chemistry collection.
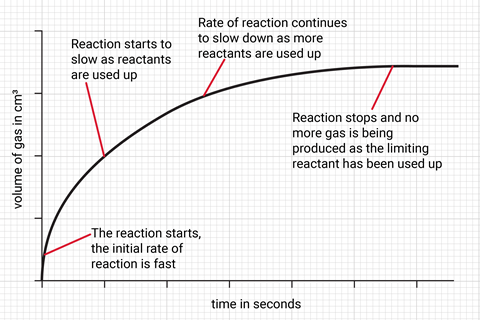
Consider the reaction between hydrochloric acid and magnesium. A graph of volume of gas against time rises steeply at first, then gradually levels off. The initial steep gradient represents a fast rate of reaction. The decreasing gradient shows the reaction slowing as reactants are used up. The plateau indicates no more gas is produced because the limiting reactant has been used up. Asking pupils to annotate and explain each section connects the line directly to collision theory and conservation of mass. It also prevents pupils from answering rate questions by reading the height of the line, a common issue when interpreting rate of reaction graphs.
Consider the reaction between hydrochloric acid and magnesium. A graph of volume of gas against time rises steeply at first, then gradually levels off (see figure 1). The initial steep gradient represents a fast rate of reaction. The decreasing gradient shows the reaction slowing as reactants are used up. The plateau indicates no more gas is produced because the limiting reactant has been used up. Asking pupils to annotate and explain each section connects the line directly to collision theory and conservation of mass. It also prevents pupils from answering rate questions by reading the height of the line, a common issue when interpreting rate of reaction graphs.
Comparison develops thinking
Comparing qualitative graphs develops this thinking further. If the same reaction is carried out at a higher temperature, students should sketch a curve with a steeper initial gradient that reaches the plateau sooner. If the quantity of limiting reactant is unchanged, both curves should reach the same final volume. This distinction matters: temperature changes the rate of this reaction, not the yield. The graph makes a common misconception visible and discussable.
Qualitative graphs are quick to draw, easy to compare and rich in diagnostic information
Other chemistry examples work just as well. On a reaction profile, students can show that a catalyst lowers activation energy while leaving the energy change of the reaction unchanged. A qualitative titration curve helps learners connect the slow and rapid changes in pH. Concentration-time graphs help learners reason about reactants, products and dynamic equilibrium, including what happens after conditions change.
This approach transfers readily across all the sciences. Students might sketch enzyme activity against temperature, photosynthesis rate against light intensity, extension against force or temperature against time during a change of state. In every case, the question is not, ‘Does the line go up or down?’ but ‘Which scientific idea explains this particular shape?’
A useful routine is to ask pupils to predict and sketch a graph before an experiment or demonstration, then compare it with the graph from actual results, identify differences and revise their explanation. You can provide sentence stems such as ‘the line becomes steeper because …’ and ‘the graph levels off when …’ to keep their responses focused on causal reasoning.
Qualitative graphs are quick to draw, easy to compare and rich in diagnostic information. Used regularly, they help learners see graphs not as pictures of data, but as visual explanations of scientific concepts. They are not an optional extra; they are a practical way to make pupils’ scientific understanding visible, testable and open to discussion and refinement.
Amanda Clegg and Karen Collins








No comments yet