


Help students grasp the Beer–Lambert law by going back to basics with spectrophotometry
Measuring the concentration of analytes and understanding the Beer–Lambert law are an important part of many chemistry curriculums. Thanks to recent breakthroughs in manufacturing and design, spectrophotometers are smaller and more accurate than ever before. As a result, they have become sealed devices or ‘black boxes’ to protect their accuracy and functionality. This offers little or no opportunity for students to see inside a spectrophotometer to investigate what it does and how it works.
There are numerous reports of home-made spectrophotometers designed by teachers and students, with impressive results. But what if you do not have access to the necessary electronics to build your own device or you do not feel comfortable working with raw electronic components?
Take out your smartphone.
This is what I did during the first wave of the Covid-19 pandemic, when RSC education coordinators made short videos showcasing experiments students can do at home. The smartphone spectroscopy video deconstructs a common spectrophotometer into its simplest components: a light source with a filter, a sample holder and a detector.
This is what I did during the first wave of the Covid-19 pandemic, when RSC education coordinators made short videos showcasing experiments students can do at home. The smartphone spectroscopy video (LINK) deconstructs a common spectrophotometer into its simplest components: a light source with a filter, a sample holder and a detector.
Do it yourself
Here’s how you can adapt the experiment for teaching the Beer–Lambert law.
You can set the activity for students to try at home or use it as a hands-on classroom experiment.
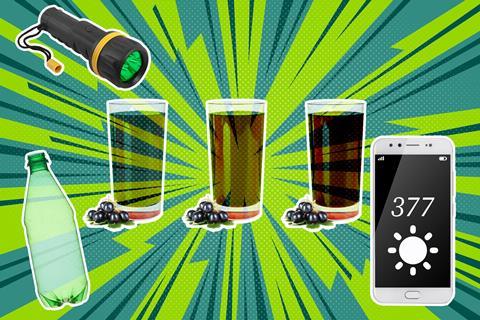
For the filters, use green sweet wrappers (Quality Street for example) or cut up a green plastic drink bottle. The blackcurrant squash drink samples are purple so they will absorb green light (green is opposite purple on the colour wheel).
Download this
Download the instructions for this simple activity as MS Word or pdf.
This activity is just as effective in the school lab as it is at home, making it a great activity for remote learning for any age. 16– 18 students can use their results to plot a graph and manipulate logarithmic equations to find the concentration of an unknown dilution of squash.
Download the instructions for this simple activity from the Education in Chemistry website: LINK.
For increased accuracy, use a small torch with a narrow beam and use identical containers such narrow drinking glasses or narrow sweet boxes (eg Tic Tac boxes). This will keep the path length of the light constant. Keep the volume of water constant too so that the only variable is the amount of blackcurrant squash added to each sample. Enclosing the entire set-up in a large box provides more consistent and accurate results as it reduces the influence of outside light. It’s important to discuss constants and variables with students, particularly when setting up experiments.
You can download a light meter smartphone app or purchase a light meter from a camera store. Sometimes called lux meters, there are many free versions available. Apps like the Arduino Science Journal and Phyphox also include a light meter function. Place the light source and filter on one side of the sample and the light meter or smartphone camera on the other side directly across from the light.
The Beer–Lambert law
The squash drink absorbs the energy of a photon of light, which reduces the transmission of the light as it passes through the sample. In dilute samples, most of the green light from the torch passes through the drink and into the light meter or smartphone camera, giving a large lux number (high transmittance). In concentrated samples there is more squash drink available to absorb the light so less light passes through to the detector, giving a smaller lux number (low transmittance).
The lux number measured by the light meter for each sample is directly proportional to the transmittance. Using a blank sample of water as the incident light, the transmittance can be calculated for each sample. Percentage transmittance (%T) is equal to 100 multiplied by the lux number of the transmitted light (I) divided by the lux number of the incident light (I0):
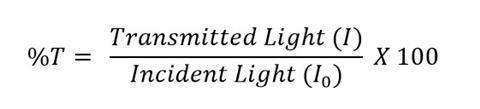
The transmittance values can be converted to absorbance for use with the Beer–Lambert Law and the following equation: Absorbance = 2 – log10 (%T). Although the results obtained from this set-up are less accurate than commercial devices, the experiment still demonstrates the Beer–Lambert law very well.
In the lab, students’ working memories can become overloaded due to the pressures of time, having to follow instructions and recall theory. By stripping spectrophotometry and the Beer–Lambert law back to basics, you can help your students conceptualise the theory more quickly and reduce misconceptions. This set-up does not replace spectrophotometers, but it will help students understand the inner workings of these devices at a fundamental level.
John O’Donoghue


2 readers' comments