


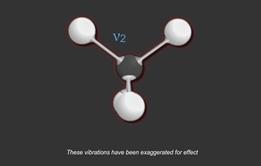
Absorption of infrared radiation brings about changes in molecular vibrations so in studying infrared spectroscopy we are looking at the ways in which bonds in molecules vibrate (see video in the previous section).
Atom size, bond length and strength vary in molecules and so the frequency at which a particular bond absorbs infrared radiation will be different over a range of bonds and modes of vibration. Measuring the absorption of infrared radiation by a material provides very useful information about structure.
Since no two organic compounds have the same IR spectrum, a compound can be identified with certainty by comparing its spectrum with that of a known pure compound. If they are identical, then they are one and the same.
The units of spectroscopy are:
c = νλ
where;
c = velocity of light (3.00 x 10⁸ m s-1)
ν = frequency (Hz)
λ = wavelength (m)
E = hν
where;
E = energy (kJ mol-1)
h = Planck’s constant (6.63 x 10‑34 Js)
The electromagnetic spectrum covers a very wide range of wavelengths, and different units are therefore used in different regions.
For very short wavelengths, nanometres (1 nm = 10-9 m) are preferred.
In the visible and UV regions, wavelengths can also be expressed in millimicrons (mμ):
1 μ = 10-6 m 1 mμ = 10-9 m therefore1 mμ = 1 nm
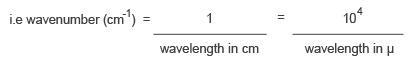
In the infrared region, wavelengths can be expressed in microns (μ).Wavenumbers are the number of waves per cm and are often referred to as reciprocal centimetres (cm-1):
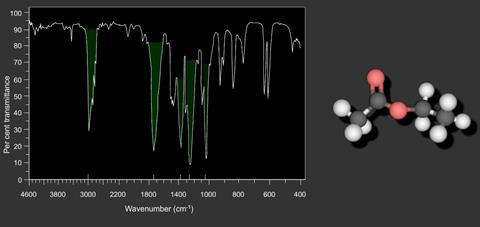
In a typical spectrum a C - H absorption occurs at 3000 cm-1 whilst a C = O absorption occurs at 1740 cm-1 at a lower wavenumber, higher frequency and higher energy than the C - H stretching vibration.
NB: Organic chemists loosely refer to wavenumbers as “frequency” and so in books and other sources you may see spectra labelled as “frequency (cm-1)”.
Widely used in both research and industry, infrared spectroscopy is a simple and reliable technique used for a variety of measurements and in quality control. It is especially useful in forensic science both in criminal and civil cases. Spectrometers are now small, and can be easily transported, even for use in field trials. With increasing progress in new technology, samples in solution can now be measured accurately (water produces a broad absorbance across the range of interest, and thus renders the spectra unreadable without this new technology).
Some instruments will also automatically tell you what a substance is by referencing it to a store of thousands of spectra held in storage.
By measuring at a specific frequency over time, changes in the character or quantity of a particular bond can be measured. This is especially useful in measuring the degree of polymerisation in polymer manufacture or in identification of polymer degradation for example.
The progress of formation of an epoxy resin being hardened by an amine cross linking agent can be monitored by observing the appearance of a hydroxy group in the spectrum of a polymerising sample (or by the disappearance of an epoxy group).
Modern research instruments can take infrared measurements across the whole range of interest as frequently as 32 times a second. This can be done whilst simultaneous measurements are made using other techniques. This makes the observations of chemical reactions and processes quicker and more accurate. Infrared spectroscopy has been highly successful for applications in both organic and inorganic chemistry.
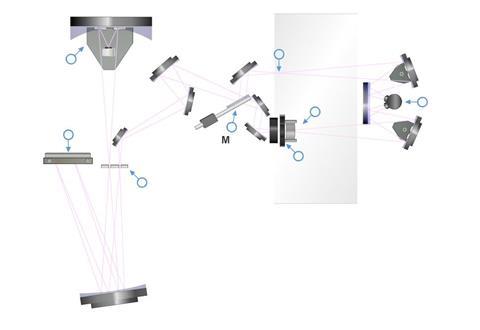
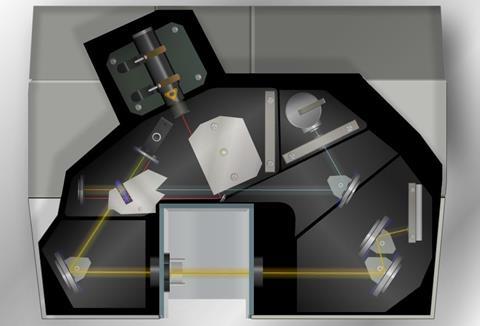
A second type of IR spectrometer is a dispersive spectrometer. The rotating mirror, M temporarily reflects the reference beam towards the machine optics whilst blocking the sample beam. Reference beam and sample beam are alternately blocked and reflected. The diffraction grating disperses the IR into a ʽspectrumʼ of wavelengths; this series is reflected to the detector. The thermocouple converts the different wavelengths of IR reaching it to a signal which is represented as a spectrum. The difference between reference and sample signals shows which parts of the spectrum have been absorbed by the sample.
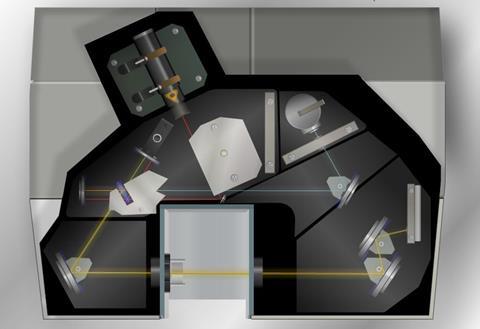
Another type of IR spectrometer is a Fourier Transform (FT) spectrometer. In the FT spectrometer, an interferometer is used instead of a diffraction grating. All frequencies (or wavelengths, ν ~ 1/λ) reach the detector at the same time. The spectrum is obtained by a mathematical calculation (a Fourier Transform). The FT spectrometer is more responsive, accurate and precise than a dispersive spectrometer.
Downloads
Interactive spectrum
Simulation | Flash, Size 77.19 kbInfrared spectrometer
Simulation | Flash, Size 69.17 kbDispersive spectrometer
Simulation | Flash, Size 14.81 kbFourier transform (FT) spectrometer
Simulation | Flash, Size 69.17 kb
Infrared (IR) spectroscopy
Absorption of infrared radiation brings about changes in molecular vibrations within molecules and ‘measurements’ of the ways in which bonds vibrate gives rise to infrared spectroscopy. Atom size, bond length and bond strength vary in molecules and so the frequency at which a particular bond absorbs infrared radiation will be ...
- 1
 Currently
reading
Currently
reading
Uses of IR spectroscopy
- 3
- 4


1 Reader's comment