


Discover strategies and approaches to help you effectively teach rates of reaction to your 11–16 learners
David Paterson updated this article on 27 February 2026.
Studying reaction kinetics leads learners to an understanding of a reaction’s mechanism and how we can control the reaction rate. For a 14 year-old student, though, the question is more likely to be ‘Why are we doing this?’ or ‘What’s it got to do with me?’
If we are to communicate rates to students, we need to use experiments and materials that have some relevance to their everyday experiences. As such, I have often wondered how students can ever be engaged with dissolving marble chips in dilute hydrochloric acid. When was the last time, if ever, the average student came across marble chips in everyday life?
Progression of ideas and skills
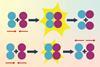
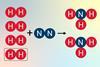
The study of rates is fundamental to a student’s understanding of chemical reactions. Students encounter the idea that reactions are the result of the rearrangement of particles into new substances and that mass is conserved during a reaction. It is important they fully understand this concept, as it leads naturally to an understanding of why altering conditions will alter the reaction rate. At a higher level, students will explain these effects in terms of the frequency of collisions between particles and the energy profile of those particles.
| Secondary range | Types of learning areas |
|---|---|
| Pre (approx 7–11) |
Effect of temperature on rate of evaporation in the water cycle Investigating reactions such as burning and neutralisation (bicarbonate of soda and acid) |
| Early (approx 11–14) |
Conservation of mass Changes of state and chemical reactions Investigating further reactions including oxidation, displacement and thermal decomposition What catalysts do |
| Mid (approx 14–16) |
Explaining reactions in terms of particle collision Factors affecting rate of reaction, including concentration (and pressure), surface area, temperature and presence of catalysts Collecting experimental data, manually and with data logging, from reactions involving mass loss, gas collection and solid precipitation Using graphs to interpret data Linking reaction rate, energy changes and equilibrium |
| Late (approx 16–19) |
Using initial rates and continuous monitoring methods Using graphs to interpret data, including determining instantaneous and average rates Determining quantitative information about reactions from experimental data (including rate equations and activation energies) Predicting reaction mechanisms |
Developing practical skills and progression
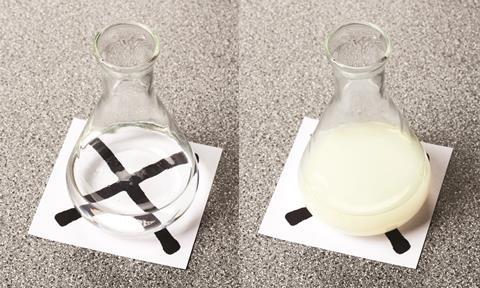
Observation skills are at the core of practical work. Students need to carry out a wide range of practical activities, both to develop these skills and to gain experience in monitoring chemical reactions. In rates experiments, students need to make a judgement about the endpoint when timing a reaction. In some cases, this is sharp and obvious, such as with the iodine clock reactions. However, in the reaction between sodium thiosulfate and acid, often called the disappearing cross reaction, students must judge when the mixture becomes opaque.
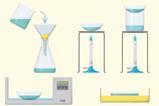
Good measuring skills are vital in rates experiments. Collecting gases can be complicated but provides a useful way for students to develop their manipulative skills. Demonstrate how to keep all the water in the measuring cylinder when inverting (a damp piece of multiply folded paper held over the top works well), then allow them to practise a few times before launching into the main experiment. You can use this idea of practising individual techniques and skills across all practical work.
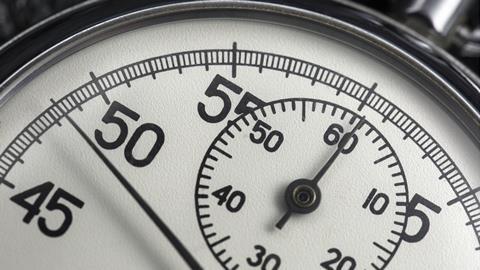
Students need to make sophisticated judgements about timing during their experiments. As well as judging when the endpoint of the reaction has been reached, they need to decide on the precision of their measurements. Ask them to consider whether recording data to the nearest 0.01 s from a digital stopwatch fits with their own reaction speed. While analogue stop clocks may not be readily available, a small strip of insulation tape over the second decimal place on the digital stopwatch can be helpful. Collecting data themselves provides a useful way for students to think about measurement accuracy and precision.
Once students have recorded data from experiments, they need to analyse it and translate it into a form that can be readily understood. Drawing appropriate graphs and using them to find a pattern of behaviour is the goal. However, you need to help students develop this skill: you may need to tell them which axes are appropriate until they can identify the independent and dependent variables themselves. In many reactions, students will need to find the gradient of a graph and interpret this in terms of the rate of the reaction. Interpreting graphs is a complex skill, sometimes made more difficult by different terminology and techniques across the departments. Talking regularly to your colleagues in the science and maths departments will help with this, and consider strategies such as thinking aloud (pdf) from the book Grappling with graphs, a treasure trove of research and resources on improving graphing skills.
Challenge your students to produce a mixture that will suddenly change colour after a defined time
You can reinforce students’ ideas about rates and reactions by including a wide range of relevant practical work, demonstrations and activities into their studies, not just those that satisfy the requirements of your exam board. Investigate conservation of mass in the spectacular precipitation of lead iodide reaction to reinforce the idea that reactions involve the rearrangement of particles. Use the rhubarb rates experiment to bring collision theory alive. In the practical, oxalic acid from pieces of rhubarb stem decolourise a solution of acidified permanganate. Students can investigate the effect of surface area on rate simply by cutting up the rhubarb pieces smaller. This can be a more approachable and relevant practical for students than marble chips dissolving in acid.
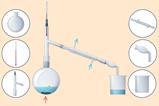
There are several suitable experiments involving the production of gases. You can use these to help students understand the effect of concentration on the rate of reaction. These experiments also develop students’ mathematical skills in processing results or developing an investigative approach to a problem. Try the reaction between magnesium and acid which uses simple laboratory apparatus and use this activity to solve an industrial problem to put these ideas into a realistic context.
Students are fascinated by sudden changes in reactions, so variations on the iodine clock reaction are often engaging. You can show an example as a demonstration, then challenge your students to produce a mixture that will suddenly change colour after a defined time. This can harness students’ natural competitiveness, engage them in applying their ideas and develop their investigative and laboratory skills. CLEAPSS has a wide range of iodine clock practical procedures and resources available, and SSERC has a musical version.
There are many experiments on the effect of catalysts on the rate of reaction and you’ll find many suggestions in the Catalysts get helping hands article.
Observation skills are at the core of practical work. Students need to carry out a wide range of practical activities, both to develop these skills and to gain experience in monitoring chemical reactions. In rates experiments, students need to make a judgement about the end point when timing a reaction. In some cases, this is sharp and obvious, such as with the iodine clock reactions (rsc.li/3OFfDir). However, in the reaction between sodium thiosulfate and acid, often called the disappearing cross reaction, students must judge when the mixture becomes opaque (rsc.li/3MTjub9).
Good measuring skills are vital in rates experiments. Collecting gases can be complicated but provides a useful way for students to develop their manipulative skills. Demonstrate how to keep all the water in the measuring cylinder when inverting (a damp piece of multiply folded paper held over the top works well), then allow them to practise a few times before launching into the main experiment. You can use this idea of practising individual techniques and skills across all practical work (rsc.li/4tsC2Q2).
Students need to make sophisticated judgements about timing during their experiments. As well as judging when the end point of the reaction has been reached, they need to decide on the precision of their measurements. Ask them to consider whether recording data to the nearest 0.01 s from a digital stopwatch fits with their own reaction speed. While analogue stop clocks may not be readily available, a small strip of insulation tape over the second decimal place on the digital stopwatch can be helpful. Collecting data themselves provides a useful way for students to think about measurement accuracy and precision.
Use the rhubarb rates experiment to bring collision theory alive … a more approachable and relevant practical for students than marble chips dissolving in acid
Once students have recorded data from experiments, they need to analyse it and translate it into a form that can be readily understood. Drawing appropriate graphs and using them to find a pattern of behaviour is the goal. However, you need to help students develop this skill: you may need to tell them which axes are appropriate until they can identify the independent and dependent variables themselves. In many reactions, students will need to find the gradient of a graph and interpret this in terms of the rate of the reaction. Interpreting graphs is a complex skill, sometimes made more difficult by different terminology and techniques across the departments. Talking regularly to your colleagues in the science and maths departments will help with this and consider strategies such as thinking aloud from the book Grappling with graphs by Amanda Clegg and Karen Collins, a treasure trove of research and resources on improving graphing skills.
You can reinforce students’ ideas about rates and reactions by including a wide range of relevant practical work, demonstrations and activities into their studies, not just those that satisfy the requirements of your exam board. Investigate conservation of mass in the spectacular precipitation of lead iodide reaction to reinforce the idea that reactions involve the rearrangement of particles (rsc.li/3MBmKI9). Use the rhubarb rates experiment to bring collision theory alive (rsc.li/3MVvglb). In the practical, oxalic acid from pieces of rhubarb stem decolourise a solution of acidified permanganate. Students can investigate the effect of surface area on rate simply by cutting up the rhubarb pieces smaller. This can be a more approachable and relevant practical for students than marble chips dissolving in acid.
There are several suitable experiments involving the production of gases. You can use these to help students understand the effect of concentration on the rate of reaction. These experiments also develop students’ mathematical skills in processing results or developing an investigative approach to a problem. Try the reaction between magnesium and acid which uses simple laboratory apparatus (sc.li/4sc6SuB) and use this activity to solve an industrial problem to these ideas into a realistic context (rsc.li/4rEVPKB).
Students are fascinated by sudden changes in reactions, so variations on the iodine clock reaction are often engaging. You can show an example as a demonstration, then challenge your students to produce a mixture that will suddenly change colour after a defined time (rsc.li/3MVvwk9). This can harness students’ natural competitiveness, engage them in applying their ideas and develop their investigative and laboratory skills. CLEAPSS has a wide range of iodine clock practical procedures and resources available, and SSERC has a musical version.
There are many experiments on the effect of catalysts on the rate of reaction and you’ll find many suggestions in the article, Catalysts get helping hands (rsc.li/4l24swm).
Practical problems and suggested solutions
As mentioned, a common experiment for investigating rates of reaction by precipitation is the disappearing cross reaction. Sodium thiosulfate reacts with acid to produce a precipitation of sulfur, making the mixture opaque. A second product is sulfur dioxide, a toxic gas, which is particularly hazardous to asthmatics. Additionally, the reaction is often used to study the effect of temperature on rate, driving further sulfur dioxide out of the solution at elevated temperatures.
You can make some simple modifications to commonly used standard methods to reduce the risk considerably. For example, cover the reaction vessel with a watch glass to contain the gas, and ensure each group has a stop bath of sodium hydrogencarbonate solution to pour the completed reaction mixture into. This alkaline solution neutralises the reaction mixture and the sulfur dioxide. Add a few drops of universal indicator to the stop baths to show when they need replenishing. Consider changing to the microscale version of the practical to significantly reduce the volumes of reagents used, which in turn reduces the amounts of sulfur dioxide produced. Other benefits of the microscale practical include reduced costs, easier setup and clear away, and faster collection of data. CLEAPSS provides fully detailed practical procedures for members on investigating rate and concentration, and rate and temperature.
Some schools use expensive glass gas syringes to measure the volume of gas produced. Gas syringes work well when properly maintained and kept clean and dry. However, too much gas can cause the syringe plunger to fall out and break. Tie a piece of string between the barrel and the plunger to limit the travel of the plunger and avoid expensive breakages. You can use plastic syringes for gas measurements, but you need to lubricate them with a silicone lubricant for the plunger to move easily. Don’t lubricate glass gas syringes as the plunger will stick.
Mathematical skills
A barrier to students’ understanding of rates is the mathematical skills they need to process numerical observations. Students often compartmentalise their learning into subjects and do not transfer their learning between classes. As mentioned, regular conversations between the maths and science departments helps with coherence and progression of the curriculum. You could even swap into a maths classroom when processing your chemistry data to help your students retrieve that maths knowledge more effectively.
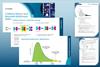
When conducting rates of reaction experiments, students need to process a considerable amount of data. They need to be able to use reciprocals (rate ∝ 1/t), and recognise and use expressions in decimal and standard form. When using reciprocal time as a measure of rate, the resultant numbers will be very small, meaning many students find handling this data quite difficult. You’ll find useful ideas of overcoming this in the article, Working with standard form in chemistry. Lots of practice of analysing numerical observations, processing data and drawing and interpreting graphs will ease students’ difficulties in maths and give them confidence when faced with such exercises in examinations.
When conducting rates of reaction experiments, students need to process a considerable amount of data. They need to be able to use reciprocals (rate ∝ 1/t), and recognise and use expressions in decimal and standard form. When using reciprocal time as a measure of rate, the resultant numbers will be very small, meaning many students find handling this data quite difficult. You’ll find useful ideas of overcoming this in the article, Working with standard form in chemistry (rsc.li/4rHwC2h). Lots of practice of analysing numerical observations, processing data and drawing and interpreting graphs will ease students’ difficulties in maths and give them confidence when faced with such exercises in examinations.
Acknowledgments
Thanks to Dorothy Warren and Kay Stephenson for their help with this article.
David Everett, a retired chemistry teacher, wrote this article in 2018. DAvi Paterson, an assistant head and chemistry teacher, updated it in 2026.


Topics
Teaching practical science

Boost your confidence and your learners’ outcomes with these articles focused on practical lessons
- 1
- 2
- 3
- 4
- 5
- 6
 Currently
reading
Currently
reading
How to teach rate experiments
- 8


No comments yet