


Ross Galloway and Simon Lancaster discuss the challenge of quantifying students’ learning
The notion of ‘learning gain’ is a deceptively simple one. We can define it as the improvement in a student’s learning between the beginning and end of a course. While we might think final assessment scores would be the most valuable indicator, it is easier to get higher final scores from students who enter courses with a high ability in the first place. Learning gain says more about how students benefit from their time in classes and less about their background or pre-existing abilities. The ability to compare learning gains and make comparative judgements is of potential value to teachers, students, educational researchers and politicians. It is the learning gain, rather than the absolute result, that indicates the effectiveness of pedagogy, the academic quality of a school and contributes to the commercial value of a degree.

Official league tables of schools have been published for years. In the higher education (HE) sector, tables are printed in newspapers but there is a promise to put them on a more official footing with the Teaching Excellence Framework (TEF). The TEF was announced in a government green paper in November 2015. At the time of writing, initial responses to the paper are being considered before a technical consultation on implementation is announced. At stake is the ability to raise tuition fees (up to an inflation-related ceiling) in line with a number of TEF levels. The ideological aspiration is that the TEF league table will introduce market economics into the HE sector.
Quantifying learning gain
One might expect learning gain to be the most important component of league tables. In practice, it is a challenge to measure. Instead, HE league tables contain absolute measures of student success; significant variations between league tables are a consequence of different weightings on these measures and limited attempts to capture the notion of learning gain.
Most large scale attempts to quantify learning gain have relied upon national examinations. Students are subjected to SATS examinations in Year 6, which can be compared to their GCSE results in Year 11, which in turn provide a baseline for expected A-level results in Year 13. Alongside this, the non-profit organisation FFT provides predictions based on socio-economic indicators against which the school can be measured. A-level results, or the even more nebulous UCAS tariff system, can be compared to degree classification, or, as these tend towards good honours, the more finely grained grade point average.

The problem with high stakes national examinations is that they can be gamed. Teachers are rewarded and recognised for how well their students do in examinations. This risks a divergence between teaching chemistry and coaching to pass an examination. How should we measure the learning gain over the degree of a student who gained an ‘A’ grade at A-level but who can only achieve a fraction of that mark on the same examination paper on arrival at university? What is the real measure of economic value: the degree classification or the conceptual understanding three months, three years or three decades after graduation?
The TEF is purported to measure learning gain, but as responses to the green paper have made clear, the closer one looks at the ostensibly worthy aspirations of the TEF, the more problematic it becomes. The Higher Education Funding Council England (HEFCE) has responded by supporting studies in measuring learning gain in higher education.1
Concept inventories
In the pedagogical research literature, the objective of determining learning gain is to gauge the effectiveness of a particular approach. In this context, the limitations of traditional examinations lie not just in their susceptibility to gaming but also in their dependence upon rote memorisation over conceptual understanding. Here, the gold standard is a concept inventory.
Concept inventories, as exemplified by the most famous example, the Force Concept Inventory,2 are carefully researched tools. Their construction begins with a series of focus groups, discussing concepts with students, exploring the prevailing model of understanding and collating common misconceptions. After this, questions are prepared and presented to a panel of experts in the field to establish their validity. Do they measure what the questioner intended? Do they address the most relevant issues? Once validity has been established, they are tested on thousands of students to ensure statistical reliability. The result is the best measure available of a student’s conceptual understanding in a given area.
Chemical concept inventories
A concept inventory gives the best measure of a student’s conceptual understanding in a given area. Some examples have been published in the following subject areas:
- chemical (lead author William Robinson)5
- molecular sciences (lead author Susan Howitt)6
- thermochemistry (lead author Jack Barbera)7
- bonding representation (lead author Stacey Lowery Bretz)8
- quantum chemistry (lead author Thomas Holme)9
Teaching to a concept inventory – responding to the first wave of results as though they were diagnostic – would spoil insight into the true effectiveness of a course. The goal is assessment purely for insight, not to optimise league table position. Also, the educator should not publish the questions or answers in case they appear on the internet – the questions might be used in diagnostic tests, examinations and quizzes, allowing students to memorise the answers, and the inventory would lose its value in measuring authentic learning gain.
Mean normalised gain
The most common method to compare the learning gain of different courses is the mean normalised gain. It is calculated as follows: if a particular student’s percentage scores pre- and post-instruction are expressed as Pre and Post, respectively, then their normalised gain, g, is

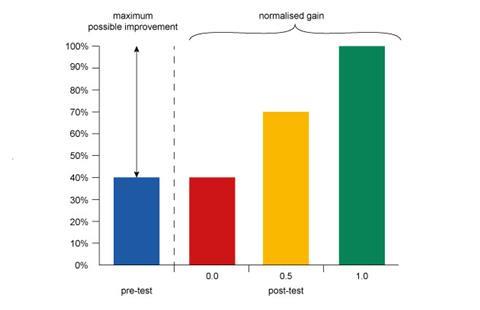
The numerator gives the absolute improvement in the student’s score on the concept inventory. The denominator is a correction factor that takes into account the available ‘headroom’. This acknowledges that it is easier for an initially low-scoring student to have a larger absolute improvement than an initially high-scoring student, since they have more opportunity to change from incorrect to correct answers.
In essence, the normalised gain is the answer to the question, ‘What fraction of the questions that the student got wrong before instruction did they get right after instruction?’ Having calculated the individual gain for each student, the mean normalised gain, <g>, is simply the mean g for all students in the class.
The maximum possible normalised gain is 1.0. This occurs when a student answers all questions correctly on the post-test. If the student makes no improvement between tests their g will be 0.0, and a half-way improvement is 0.5.
Of course, it is possible for a student’s performance to deteriorate. In this case, the normalised gain is negative. The nature of the calculation makes this particularly acute for students who perform well on the pre-test: since their ‘headroom’ is low, even a modest deterioration can result in large negative gains. (In fact, g has an upper bound of +1.0 but a lower bound of –∞.) This asymmetry is one of the main criticisms of mean normalised gain as a measure, but its conceptual simplicity, ease of calculation and widespread existing use maintain its position as the leading measure of learning gain.
A striking example of the value of the mean normalised gain can be found in the work of Richard Hake.3 In his landmark study of 6000 US college students in the late 1990s, he used results from the Force Concept Inventory to compare introductory physics courses using interactive engagement teaching methods with those using more traditional, passive instruction. He observed that traditional lectures gave <g> from 0–0.3, whereas the values for interactive engagement classes were 0.2–0.7, with a typical value of about 0.5. This work showed that interactive engagement was generally substantially more effective than passive methods.
Role of the concept inventory
Robust statistics like these are best obtained from a concept inventory that has been rigorously evaluated for validity and reliability. To reach suitable levels on both measures, multiple iterations and refinements are needed, a process that can take many years. As a result, concept inventories only exist for a few topic areas. It is impractical to contemplate concept inventories as routine measures of learning gain in all areas.
Proxies to learning gain
We see the role of the concept inventory as providing a standard against which other methods and proxies to learning gain can be compared. Once the effectiveness of these proxies is determined, we can then forego the unsustainable burden of generally determining learning gain to this gold standard. One such proxy is a national student engagement survey – the extent of student engagement on a degree course is strongly correlated with measures of success. Another is academic self-efficacy10 – a student’s belief in their ability to succeed in an academic setting.
The American Chemical Society National Examinations are as close as any discipline comes to the ideal validated examination. Annually, the ACS generates examination papers covering a range of disciplinary areas within chemistry. These are used by different institutions around the world (predominantly in North America), and since all students take the same paper, direct inter-institutional and inter-course comparisons are possible. Chemistry as a discipline is almost uniquely fortunate in having access to standardised, HE-level examination papers such as these, but one disadvantage is that, for the comparisons to be valid, students must be able to tackle the questions set on the paper in a fair manner: this places inevitable restrictions on the flexibility of the curriculum that can be used.
In conclusion, a note of caution: the term ‘learning gain’ is widely used in educational research in a restricted, technical sense, such as in our discussion of mean normalised learning gain. There is a danger of inadvertent overloading of this language with ‘learning gain’ in the more general sense.
Parallels can be drawn with the term ‘learning styles’. Many educators use these words simply to mean different approaches to learning or different classroom tasks, but this is often conflated with Learning Styles in the technical sense, which is the contention that different modes of instruction are more effective for individuals with different learning preferences (most often divided into visual, auditory and kinaesthetic modes). Learning Styles have been largely discredited,4 but we have witnessed discussions between educators becoming derailed by usage in the former sense being interpreted as being in the latter sense.
If ‘learning gain’ is to become widely used, we must be careful not to accidentally conflate it with the technical measures widely referenced in the literature; at best, this will be confusing, and at worst, in the event of ‘learning gain’ acquiring the connotations of a poorly-conceived and counterproductive TEF metric, we risk decades of progress in educational research being accidentally tainted by association. As rigorous, quantified learning gains are one of the most valuable indicators available to educational research, it would be unfortunate if they became principally known as misleading, easily gamed contributors to questionable league tables.
Ross Galloway is a senior teaching development officer in the school of physics and astronomy at the University of Edinburgh, UK. Simon Lancaster is a professor of chemical education at the University of East Anglia, UK
References
1 https://www.officeforstudents.org.uk/advice-and-guidance/the-tef/learning-gain/ We have focused on notions of learning gain, in particular conceptual understanding, most relevant to chemistry. The HEFCE-funded pilot projects that may ultimately inform the TEF are also looking at work-readiness, cognitive skills, critical reflection, situational judgement skills and research skills.
2 D Hestenes, M Wells and G Swackhamer, Phys. Teach., 1992, 30, 141 (DOI: 10.1119/1.2343497)
3 R R Hake, Am. J. Phys., 1998, 66, 64 (DOI: 10.1119/1.18809)
4 H Pashler et al, Psychol. Sci. Public Interest, 2009, 9, 105 (DOI: 10.1111/j.1539-6053.2009.01038.x)
5 D R Mulford and W R Robinson, J. Chem. Educ., 2002, 79, 739 (DOI: 10.1021/ed079p739)
6 Australian Biochemist, December 2008, p14 (pdf)
7 D Wren and J Barbera, J. Chem. Educ., 2013, 90, 1590 (DOI: 10.1021/ed400384g)
8 C J Luxford and S L Bretz, J. Chem. Educ., 2014, 91, 312 (DOI: 10.1021/ed400700q)
9 M Dick-Perez et al, J. Chem. Educ., 2016, 93, 605 (DOI: 10.1021/acs.jchemed.5b00781)
10 H L Sharma and G Nasa, Br. J. Educ., 2014, 2, 57 (pdf)


No comments yet