


Use this tutorial, including a video demonstration, to help post-16 students learn about equilibrium, the Gibbs free energy and the feasibility of chemical reactions
The total entropy change of a system and its surroundings can be used to predict the direction of a reaction. However, chemists often prefer to think in terms of energy rather than entropy.
In chemical thermodynamics, the Gibbs free energy gives scientists an alternative function for predicting the direction or feasibility of a reaction, based on the more familiar concept of energy.
This tutorial introduces students to the Gibbs free energy and invites them to develop and apply their understanding through a range of important and related ideas. Key topics include:
- Equilibrium and equilibrium mixtures
- The relation between the Gibbs free energy, temperature and the equilibrium constant
- Constructing and interpreting Ellingham diagrams
The tutorial also features a video demonstration designed to illustrate one example of how free energy might be used.
Note
The interactive ‘simulations’ for this tutorial are currently unavailable. However, you may find it helpful to read any accompanying instructions, observations and conclusions relating to the simulations below.
Introducing the Gibbs free energy
We can use ΔStotal to predict the direction of a reaction, but largely for historical reasons chemists prefer to think in terms of energy.
The total entropy change is the sum of the entropy changes of the system and its surroundings (see thetutorial on entropy):
ΔStotal = ΔSsystem + ΔSsurroundings
But remember:
ΔSsurroundings = -ΔH/ T
So:
ΔStotal = ΔSsystem + (–ΔH/ T)
If we multiply through by –T, we get:
–TΔStotal = ΔH – TΔSsystem
Since entropy has units of J K-1 mol-1, T x ΔS has units of J mol-1 and is a measure of energy.
Note
We must take care when using mathematical expressions that include both energy and entropy. Chemists normally measure energy (both enthalpy and Gibbs free energy) in kJ mol-1 (kilojoules per mole) but measure entropy in J K-1 mol-1 (joules per kelvin per mole). So it is necessary to convert the units, usually by dividing the entropy values by 1000 so that they are measured in kJ K-1 mol-1.
We call the term ‘–TΔStotal’ the Gibbs free energy, after the American chemist Josiah Willard Gibbs. It is given the symbol ΔG, so:
ΔG = ΔH – TΔSsystem
Notice that if ΔG is negative, the reaction is feasible. Notice also that all the terms in the expression relate to the system rather than the surroundings. This is what makes this quantity so useful to chemists. It is also an energy term, which is a concept more familiar to most chemists than entropy.
The temperature dependence of the Gibbs free energy
We can see from the expression for the Gibbs free energy that the value of ΔG depends on temperature:
ΔG = ΔH – TΔSsystem
Sometimes, changing the temperature can change the sign of ΔG. This explains why some reactions go in one direction at one temperature and in the opposite direction at a different temperature.
For example, let us look at the reaction between calcium oxide and carbon dioxide (considered in the tutorial on chemical reactions and direction):
CaO(s) + CO2(g)→ CaCO3(s)
For this reaction, ΔH is –178 kJ mol-1 (ie –178 000 J mol-1) and ΔSsystem is –161 J K-1 mol-1.
Note
ΔSsystem is calculated from the difference between the total entropy of the product(s) and the total entropy of the reactants. The data can be obtained from the table, ‘Some values of entropies’, in the entropy tutorial.
S (CaCO3) = 93 J K-1 mol-1
S (CaO) = 40 J K-1 mol-1
S (CO2) = 214 J K-1 mol-1
So:
ΔSsystem = 92 – (40 + 214)
= –161 J K-1 mol-1
If ΔG is negative, the reaction ‘goes’ from left to right. If it is positive, the reaction goes in the opposite direction.
Let us put in some figures (see below for a note on ΔH as we use it in these calculations).
At 298 K (room temperature)
ΔG = ΔH – TΔSsystem
ΔG = –178 – (298 x –0.161)
(Remember to convert entropy in J K-1 mol-1 to kJ K-1 mol-1.)
ΔG = –178 + 48
ΔG = –130 kJ mol-1
ΔG is negative and the reaction is feasible at this temperature. It is the reaction that happens in an absorption tube.
At 1500K (the sort of temperature in a lime kiln)
ΔG = ΔH – TΔSsystem
ΔG = –178 – (1500 x –0.161)
(Remember to convert entropy in J K-1 mol-1 to kJ K-1 mol-1.)
ΔG = –178 + 242
ΔG = +64 kJ mol-1
ΔG is positive and the reaction is not feasible at this temperature. In fact, the reverse reaction, which will have ΔG = –64 kJ mol-1 is feasible and this is the reaction that occurs in a lime kiln.
Is there a ‘crossover point’?
The ‘crossover point’ is when ΔG is zero. At this point:
0 = ΔH – TΔSsystem
ie ΔH = TΔSsystem
Putting in the figures:
–178 000 = T x –161
So:
T = 178 000 / 161 = 1105 K
So this temperature is a sort of ‘tipping point’ between the reaction being feasible or not.
Note on ΔH
Throughout these calculations, we have assumed that ΔH does not change with temperature. This is an approximation only, but for most reactions the change with temperature is small.
ΔSsystem may change with temperature. For example, if one of the reactants or products changes state (melts or boils) this will affect ΔSsystem. In fact, the reaction does not simply ‘flip’ between feasibility and non-feasibility (or going in one direction or the other). If the reaction were to take place in a closed system, an equilibrium would be set up.
As a rule of thumb, reactions with ΔG more negative than –60 kJ mol-1 are considered to go to completion while those with ΔG more positive than +60 kJ mol-1 are considered not to occur at all. Between these temperatures, the reaction is considered to be reversible and in a closed system an equilibrium would be set up containing some of all the reactants and products concerned.
The approach to equilibrium
A reversible reaction has two reactions, forward and back occurring at the same time. Under certain circumstances, this may result in a situation where the amounts of reactants and products remain the same (‘an equilibrium mixture’) even though both forward and back reactions are still continuing.
Equilibrium simulation
Introduction
This simulation models this in an extremely simple way by modifying the ‘Entropy and disorder’ simulation so that the intrinsic rates of forward and back reactions (ie the probability of A converting to B or B converting to A) can be varied. (The ‘intrinsic rate’ is essentially related to the rate constant of the reaction, but it may not be helpful to use this terminology at this point.)
The simulation makes no attempt to model a real chemical situation (although it is analogous to an isomerisation reaction).
You may find it useful to start by setting the forward rate very high (L → R) and the backwards rate very low (R → L).
Key observations
At equilibrium (ie when the numbers of particles in each box remains constant) the number of particles moving from left to right in a given time period must be equal to the number moving from right to left. If the intrinsic L → R rate is greater than the intrinsic R → L rate, then this will result in more particles in the right hand box once equilibrium is reached.
Notice that even when a steady state (‘an equilibrium’) has been reached, there is still movement of counters between the two boxes. However, the number of particles moving L → R in a given time period is exactly the same as the number moving R → L.
The Gibbs free energy and equilibrium
Real reactions are more complex. As in the simulation, the equilibrium position is governed by the intrinsic rates (rate constants) of the forward and back reactions. As there is usually more than one reactant and product, their proportions can vary.
Note
It is important here to distinguish between the overall rate of particles moving from box to box and the intrinsic rate, which is related to the probability of an individual particle moving from one box to the other.
The intrinsic rate is analogous to the rate constant of a chemical reaction while the overall rate is analogous to the observed rate.
The overall rate is the intrinsic rate multiplied by the number of particles in the relevant box.
Temperature also affects the equilibrium position. The ‘Equilibrium mixtures’ simulation allows you to investigate the effect of changing the initial concentrations of reactant and products and also the temperature on some important reversible reactions.
Equilibrium mixtures simulation
Instructions
- Choose a reaction from the Reaction library.
- Drag the tops of the blue (or black in the monochrome colour scheme) rectangles on either side of the equilibrium to adjust the initial concentrations of the reactants or products.
- The red (or white in monochrome) rectangles display the concentrations after equilibrium has been established.
- It is also possible to use the slider to artificially increase or decrease the equilibrium constant. (In reality this can only be done by changing the temperature.)
- Explore the effect of temperature on the equilibrium position when ΔH is negative or positive.
Key observations
For reactions with a positive value of ΔH (ie those that absorb heat from the surroundings on going from left to right), increasing the temperature increases the amount of product. In other words, the reaction responds to being heated by absorbing heat. For reactions with a negative value of ΔH, the reverse occurs.
Increasing the initial concentration of one or more of the reactants results in more product in the equilibrium mixture.
Le Chatelier’s principle
Both these effects can be summed up in Le Chatelier’s principle, which states that if a system at equilibrium is disturbed, the equilibrium moves in the direction that tends to reduce the disturbance.
We measure the position of equilibrium in a reversible reaction by the equilibrium constant. This is a ratio of the general form: products / reactants. So, the bigger the value, the further the equilibrium is over to the right (products) side.
More formally, for a given reaction,
aA + bB + cC ⇌ xX + yY + zZ
the following expression is a constant at a particular temperature:
[X]x eqm [Y]y eqm [Z]z eqm / [A]a eqm [B]b eqm [C]c eqm
This expression is called Kc.
The subscript c means that it is expressed in terms of concentration. However, for gas reactions we use the partial pressure instead of concentration.
Conclusion
Perhaps not surprisingly, we find that the equilibrium constant is linked to ΔG. The more negative is ΔG, the more products predominate and the bigger the equilibrium constant.
The mathematical expression is:
ΔG = –RT lnK
or
ΔG = –2.3 RT log10K
The negative sign means that as ΔG becomes more negative, Kc gets bigger and the reaction gets nearer completion, ie with a greater proportion of products in the reaction mixture.
Note
The factor of 2.3 converts between the use of natural logs, ln, and logs to the base 10, log10, sometimes just written ‘log’).
‘R’ is the gas constant. It has a value of 8.3 J K-1 mol-1.
Using the above expression, a value of ΔG of –57 kJ mol-1 corresponds to an equilibrium constant of 1 x 10¹⁰ (the units depend on the reaction), ie the reaction is effectively complete. A ΔG of +57 kJ mol-1 corresponds to an equilibrium constant of 1 x 10¹⁰ (the units depend on the reaction), ie the reaction does not take place at all in effect. This is the basis of the ±60 kJ mol-1 rule of thumb mentioned above.
The Gibbs free energy, temperature and the equilibrium constant
ΔG depends on temperature and, therefore, so does the equilibrium constant.
Graphs of ΔG against temperature show how reaction feasibility changes. As a rule of thumb, if ΔG is more negative than –60 kJ mol-1, the reaction is considered to be complete, and if more positive than +60 kJ mol-1, it is considered not to ‘go’ at all (ie the reverse reaction is complete). If ΔG is in the grey area between these values, the reaction is considered to be reversible.
Temperature and the Gibbs free energy graph simulation
Instructions
- Add reactions to the graph by clicking on the add/remove buttons in the table below the graph.
- The temperature axis can be rescaled by left clicking on the graph at the start point, dragging the mouse to the end point and releasing the button.
- To reset the temperature scale to the default just double click anywhere on the x-axis.
Extension
Remove all reactions from the graph and add this one:
CaO(s) + CO2(g)⇌ CaCO3(s)
Now we can work out the temperature when ΔG = 0 (the tipping point between the reaction going to the right or the left).
Note that it slopes up from left to right, ie as the temperature increases, the reaction becomes less feasible. This is because the graph is really a graph of the expression:
ΔG = ΔH – TΔS
So, the slope or gradient of the graph is –ΔS. As we have seen, ΔS for this reaction is negative so the slope is positive. The slope remains the same because there is no change in ΔS with temperature.
The temperature when ΔG is zero is approximately 1100 K which is what we worked out earlier. We can plot the same graph for other reactions such as the equilibrium reactions looked at earlier.
Ellingham diagrams
An important industrial problem is extracting metals from their ores. Ores are usually metal oxides or compounds like sulfides and carbonates which can easily be converted to oxides by heating them in air (roasting).
The problem is to find a suitable reducing agent which will convert the oxide to the metal. The reducing agent should ideally be cheap and do the reduction at as low a temperature as possible to reduce fuel energy costs. Coke (an impure form of carbon) is a cheap and common reducing agent as it removes oxygen from metal oxides as carbon monoxide (or carbon dioxide).
We can predict which reducing agents can reduce which oxides and at which temperatures by using the graphing facility to plot ΔG against T for a variety of relevant reactions. All the reactions are written so that they involve 1 mole of oxygen molecules. Such a diagram is called an ‘Ellingham diagram’, but the graph is exactly the same as before – ΔG against temperature.
For most of the reactions, as written, ΔG is negative over the whole temperature range, so the formation of the metal oxide is feasible and the reverse reaction (extracting the metal from its oxide) is not.
The interesting situation is when two elements ‘compete’ for the oxygen. At any temperature, the reaction represented by the lower line will have the more negative value of ΔG. If the two reactions are ‘competing’, the lower one will go forwards and drive the other in reverse.
Temperature and the Gibbs free energy graph simulation
A key point in the graphs is the crossover point of two reaction lines. Here, ΔG for each reaction has the same numerical value.
Either side of the crossover point, the reaction represented by the lower line (the one with the more negative value of ΔG) will go forwards while that represented by the upper line will go in reverse.
It is therefore possible to predict the temperature above which, say, carbon will reduce any particular metal oxide. Since the 2C + O2→ 2CO line slopes downwards with temperature and the lines for the oxidations of metals slope upwards, this temperature will always be above the temperature of the crossover point.
Example
Can carbon be used to reduce zinc oxide to zinc at 1000 K? What about at 1500 K?
The reaction we require is:
2C + 2ZnO → 2CO + 2Zn
The graph shows that at 1000 K we have the following approximate ΔG values:
- 2C + O2→ 2CO ΔG = –400 kJ mol-1
- 2Zn + O2→ 2ZnO ΔG = –550 kJ mol-1
So, reversing reaction 2:
- 2ZnO → 2Zn + O2 ΔG = +550 kJ mol-1
Note: reversing the reaction reverses the sign of ΔG.
Adding 1 and 3, we get:
- 2C + O2 + 2ZnO → 2CO + 2ZnO + O2 ΔG = –400 + 550 = +150 kJ mol-1
So, at 1000 K the reaction is not feasible.
At 1500 K we have the following ΔG values:
- 2C + O2→ 2CO ΔG = –500 kJ mol-1
- 2Zn + O2→ 2ZnO ΔG = –250 kJ mol-1
So:
- 2ZnO → 2Zn + O2 ΔG = +250 kJ mol-1
Adding 5 and 7 and cancelling the oxygens as above we get:
- 2ZnO + 2C → 2CO + 2Zn ΔG = -250 kJ mol-1
So, at 1500 K the reaction is feasible.
At the point on the graph that where the two lines cross, ΔG = 0. Thus the reaction above is feasible at temperatures above 1200 K.
Note
Remember:
ΔG = ΔH – TΔSsystem
So, a graph of ΔG against T has a slope of –ΔSsystem.
Changes of slope indicate that the value of ΔSsystem has changed. This happens at temperatures where one of the reactants or products changes state (melts or boils) and hence the value of its entropy changes.
It is possible to short circuit the above procedure. Plot just the lines for the two processes concerned. At any temperature, the reaction represented by the lower line will have a more negative value of ΔG than the reaction represented by the upper line. So the reaction represented by the lower line will go forwards and drive the reaction represented by the upper line in reverse giving a negative value of ΔG for the overall reaction. For example, carbon going to carbon monoxide will only reduce magnesium oxide at temperatures above 2000 K.
Carbon, in the form of coke, is used as a reducing agent in a number of industrial processes, most notably in the production of iron, where iron oxides (largely iron(III) oxide, Fe2O3) are reduced to iron in the blast furnace.
Why is energy ‘free’?
Why do we use the word ‘free’ energy in the term ‘Gibbs free energy’ and in what sense is it free?
Let us look again at the reaction:
HCl(g) + NH3(g) → NH4Cl(s)
We have seen that this is a reaction in which ΔH is negative (energy is given out from system to surroundings) and ΔSsystem is negative (the solid product is more ordered than the gaseous reactants).
The second law of thermodynamics tells us that this reaction (and all other reactions) is only possible if the entropy of the universe (ie system + surroundings) increases. This happens because the reaction gives out heat energy to the surroundings which increases the entropy of the surroundings to outweigh the entropy decrease of the system.
The figures (which we have calculated earlier) are:
ΔH = –176 kJ mol-1
ΔSsystem = –284 J K-1 mol-1
So, ΔSsurroundings must be at least +284 J K-1 mol-1 or the reaction cannot take place, according to the second law of thermodynamics.
We have seen above that the heat given out by the reaction is more than enough to do this, which is why the reaction can take place. But just how much of this energy is actually needed to make the reaction feasible?
We know that:
ΔSsurroundings = –ΔH / T
So:
ΔH = –TΔSsurroundings
At room temperature (298 K):
ΔH = –298 x 284/1000 (remember to convert entropy in J K-1 mol-1 to kJ K-1 mol-1)
ΔH = –85 kJ mol-1
Let us be clear what this result means. Of the 176 kJ mol-1 of energy produced in the reaction by bonds breaking and making by the reaction, 85 kJ mol-1 must be given out to the surroundings as heat to make the reaction feasible. The rest is ‘free’ energy and could in principle be given out in some form other than heat.
Looking at the other side of the coin, of the 176 kJ mol-1 available from bond breaking and making, 85 kJ mol-1 must be given out as heat. This part of the energy is not ‘free’ at all – it can only be given out as heat or the reaction cannot happen.
How can free energy be used?
In the previous example, it is not easy to see how the energy produced by the reaction could be harnessed in any way except heat. However, the next example – an example of an electrochemical cell – illustrates the point in a more practical way.
The reaction below occurs readily in a test tube:
2Ag+(aq) + Cu(s) → 2Ag(s) + Cu2+(aq)
ΔH = –147 kJ mol-1
Watch the reaction take place in this video demonstration:
Simply looking at the reactants and products suggests that ΔSsystem will be negative because two mobile ions on the left produce one on the right – the products are more ordered than the reactants. This is in fact the case, ΔSsystem = –193 J K-1 mol-1.
Some heat energy must be transferred from system to the surroundings to make the total entropy change positive. We can calculate this as above.
ΔSsurroundings = –ΔH / T
So:
ΔH = –TΔSsurroundings
At room temperature (298 K):
ΔH = –298 x 193/1000 (remember to convert entropy in J K-1 mol-1 to kJ K-1 mol-1)
ΔH = –58 kJ mol-1
Of the 147 kJ mol-1 of energy available from the reaction, 58 kJ mol-1 must be given out as heat to increase the entropy of the surroundings. The rest is ‘free’ to be given out in other forms.
In this case we can see how energy might be extracted other than as heat. We can carry out the reaction in an electrochemical cell. This splits the reaction into two halves each of which takes place in a separate container but the overall reaction is exactly the same as are the entropy and enthalpy changes.
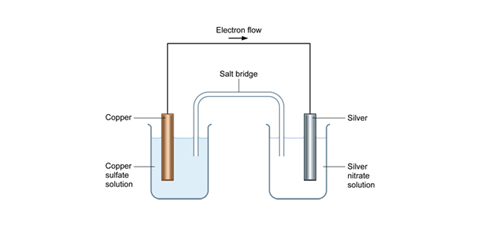
In the left hand beaker, we have the half reaction:
Cu(s) → Cu2+(aq) + 2e–
The electrons released travel through the wire to the piece of silver in the right hand beaker and drive this half reaction:
2Ag+(aq) + 2e– → 2Ag(s)
This is a redox (electron transfer) reaction, something which is made clear by the fact that electrons travel through the wire.
The cell diagram for this arrangement is:
Cu(s) | Cu2+(aq) || Ag+(aq) | Ag(s) Eθ = +0.46 V
The overall reaction (obtained by adding the two half reactions) and cancelling the electrons is exactly the same as the reaction that takes place in a single beaker by directly mixing the reactants.
Cu(s) + 2Ag+(aq) + 2e– → Cu2+(aq) + 2Ag(s) + 2e–
However, we can now see how to extract energy from this reaction in a form other than heat. We can use the electrical energy produced by the electron flow to light a bulb (light energy) or turn a motor (kinetic energy) or lift a weight (mechanical energy).
Of the 193 kJ mol-1 of energy produced by the reaction, we have already seen that 58 kJ mol-1 must be given out as heat to the surroundings, but the rest (135 kJ mol-1) is ‘free’. This is the maximum amount that we can extract as electrical energy and turn into other forms of energy. Although ΔH is –193 kJ mol-1, no amount of chemical ingenuity or clever engineering can possibly extract more than 135 kJ mol-1 as electrical energy (or in fact any type of energy except heat).
Enthalpy change and the Gibbs free energy
At the pre-16 level, students may well have developed the idea that exothermic reactions (ΔH –ve) tend to occur while endothermic ones (ΔH +ve) do not. Indeed, many chemists use this as a rule of thumb. That it works as a rule of thumb is due to the fact that we live and do most of our chemistry in a (relatively) low temperature world.
Remember:
ΔG = ΔH – TΔSsystem
If T is relatively small (and room temperature – approximately 298 K – is relatively small), the term TΔSsystem will also be small and ΔG → ΔH. So the sign of ΔH is generally the same as that of ΔG and it acts as a reasonably good predictor of reaction feasibility.
Essentially this means that at relatively low temperatures, the total entropy change of most reactions is dominated by the entropy change of the surroundings brought about by the energy changes due to bond breaking and making. At higher temperatures, the total entropy change of the reaction is dominated by the entropy change of the system.
Summary
Key points from each of the post-16 thermodynamics tutorials include:
- ΔH is the enthalpy change of the reaction.
- If ΔH is negative, the reaction is exothermic (heat is given out to the surroundings).
- If ΔH is positive, the reaction is endothermic (heat is taken in from the surroundings).
- ΔS is the entropy change of the reaction.
- The general trend for entropy is Ssolids < Sliquids < Sgasses.
- If ΔS is negative, the products are less disordered than the reactants.
- If ΔS is positive, the products are more disordered than the reactants.
- ΔSsystem only has to be positive in a closed system (where energy cannot flow in or out of the system boundary).
- It is perfectly reasonable for the products to be less disordered than the reactants if accompanied by a sufficient heat loss to the surroundings (which, in turn, increases the disorder of the surroundings, ΔSsurroundings > 0).
- The Gibbs energy (ΔG) tells us about the feasibility of reactions.
- If ΔG is negative, the forward direction is favoured.
- If ΔG is positive, the reverse direction is favoured.
- ΔG depends on ΔH and ΔSsystem.
For ΔG = ΔH – TΔSsystem, the table below summarises information regarding the feasibility of reactions:
| ΔH positive | ΔH negative | |
| ΔSsystem positive | reaction is feasible at high T | the reaction is always feasible |
| ΔSsystem negative | reaction is never feasible | reaction is feasible at low T |
Additional information
This resource was originally published by the Royal Society of Chemistry in 2015 as part of the Quantum Casino website, with support from Reckitt Benckiser.
Post-16 thermodynamics tutorials

Thinking about how to teach thermodynamics? Try these tutorials, including videos and animations, to help post-16 students learn about the key topics.
- 1
- 2
- 3
 Currently
reading
Currently
reading
The Gibbs free energy


3 readers' comments