


Help your 11–16 students to observe and monitor reactions, and recognise their uses in everyday life
David Paterson updated this article on 4 November 2025.
Bubbles, fizzing, colours, heat – observable signs of a chemical reaction are often very exciting to younger students, conjuring enthusiasm and curiosity for the subject. Ask them why they think there is a chemical reaction, and the answers are bound to include, ‘look, there are bubbles’, ‘it changed colour’ or ‘it’s getting hot!’ These obvious signs pave the way for a more detailed look at what is happening in a chemical reaction, even when the signs of a reaction are not so obvious to the naked eye.
Why monitor reactions?
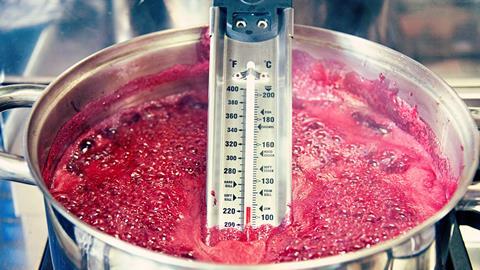
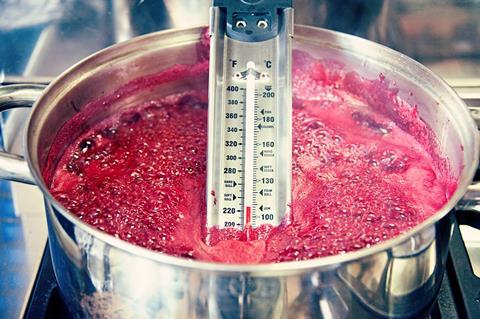
For our students, trying to figure out what is going on in a reaction vessel may seem very remote from everyday life. Use real-world contexts to help them realise the advantages of checking what is going on. For example, in jam making, we can observe the fruity mixture boiling in the pan, but we need to know if it has boiled hard enough and for long enough. A traditional method for checking is to put small samples onto a cold plate to see whether the jam sets. A more reliable method is to monitor the temperature with a thermometer and ensure the jam reaches 105°C.
In agriculture, we monitor the pH of soil to maintain optimal conditions for the uptake of nutrients and the growth of different crops. This helps to maximise yield, while sustaining the health of the soil. In pharmaceutical development, we monitor the progress of synthesis reactions to know when intermediates or the final products have been successfully produced. Thin-layer chromatography is a rapid and reliable method scientists commonly use in academic and industrial laboratories, and you can also use it in the school laboratory. Students can complete a full synthesis and analysis of paracetamol using the RSC’s Paracetamol book.
In agriculture, we monitor the pH of soil to maintain optimal conditions for the uptake of nutrients and the growth of different crops. This helps to maximise yield, while sustaining the health of the soil. In pharmaceutical development, we monitor the progress of synthesis reactions to know when intermediates or the final products have been successfully produced. Thin-layer chromatography is a rapid and reliable method scientists commonly use in academic and industrial laboratories, and you can also use it in the school laboratory. Students can complete a full synthesis and analysis of paracetamol using the RSC’s Paracetamol book (rsc.li/4qrk0w6).
Progression of ideas and skills
As students move through their secondary education, they should carry out many reactions that need monitoring, including watching practical demonstrations. Their observation skills will develop alongside their use of increasingly sophisticated measuring apparatus and techniques, as well as their conceptual understanding.
As students move through their secondary education, they should carry out many reactions that need monitoring, including watching practical demonstrations. Their observation skills will develop alongside their use of increasingly sophisticated measuring apparatus and techniques, as well as their conceptual understanding (rsc.li/43tMcnS).
| Secondary range | Types of learning areas |
|---|---|
| Pre (approx 7–11) |
Make systematic and careful observations Take accurate measurements using a range of equipment including thermometers and data loggers Macroscopic (things we can see) to submicroscopic (things that are too small to see) Conservation of mass |
| Early (approx 11–14) |
Make and record observations and measurements using a range of methods for different investigations Interpret observations and data, including identifying patterns and using observations, measurements and data to draw conclusions Signs of a chemical reaction – change of temperature, colour change, bubbles Mixtures and compounds Grouping substances as acids and alkalis (use of indicator or indicator paper) Word and formula equations to describe chemical reactions |
| Mid (approx 14–16) |
Use of appropriate apparatus and techniques for conducting and monitoring chemical reactions, including measurement of pH in different situations Classes of reaction, e.g. reactions of acids, neutralisation, decomposition Use of chemical indicators in reactions of acid and bases/alkalis Energy changes in reactions Modelling reactions Writing a balanced equation The moles and ratios from equations |
| Late (approx 16–19) |
Measure pH using indicators, pH meter or pH probes to monitor a titration reaction Measure rates of reaction by different techniques, such as initial rates and continuous monitoring Thin-layer chromatography in organic synthesis Choosing the correct indicator for various strong/weak acid/alkali titrations |
Underpinning chemistry and progression
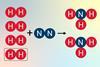
Students need to have a good understanding that reactions involve the rearrangement of particles into new substances and that mass and energy are conserved during a reaction. They need to fully understand the concept that bond breaking and making leads to the overall energy change of a reaction, and that this is associated with a change in temperature which they can measure.
Use activities such as What is a chemical reaction?, Decomposition reactions and the article, Ways to teach neutralisation and pH to help consolidate your students’ ideas about some fundamentals of chemistry. Reading Michael Seery’s article on taking care of your (scientific) language in the classroom will help you too.
Use activities such as ’What is a chemical reaction?’ (rsc.li/49dhnYf), ’Decomposition reactions’ (rsc.li/47gUbpx) and the article, ‘Ways to teach neutralisation and pH’ (rsc.li/470hPYA) to help consolidate your students’ ideas about some fundamentals of chemistry. Reading Michael Seery’s article on taking care of your (scientific) language in the classroom will help you too (rsc.li/42Q3ECS).
Practical problems and suggested solutions
Monitoring reactions by temperature changes
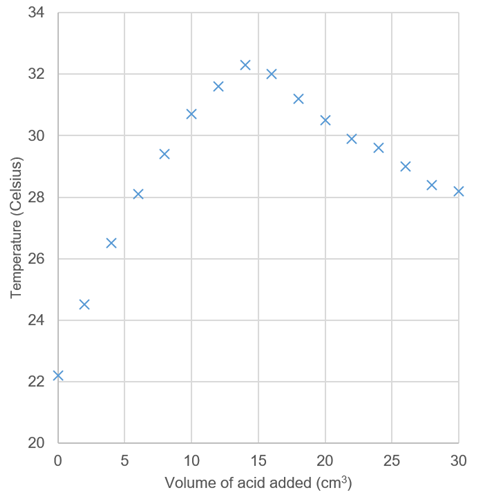
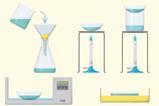
Engaging and robust practical activities that give opportunities to make and interpret clear observations and measurements are important for developing understanding. Use thermometric titration as a reliable practical activity that allows monitoring of reaction via temperature. Small and measured aliquots of a strong acid, e.g. hydrochloric acid from a burette, can be added to a strong alkali in an insulated cup with a thermometer to measure the increase in temperature as the neutralisation reaction proceeds. The reaction gives out heat energy as the net result of bonds breaking and new bonds forming. This activity allows students to determine the point of neutralisation by identifying the maximum temperature.
Engaging and robust practical activities that give opportunities to make and interpret clear observations and measurements are important for developing understanding. Use thermometric titration as a reliable practical activity that allows monitoring of reaction via temperature (rsc.li/4nfCRXS). Small and measured aliquots of a strong acid, e.g. hydrochloric acid from a burette, can be added to a strong alkali in an insulated cup with a thermometer to measure the increase in temperature as the neutralisation reaction proceeds. The reaction gives out heat energy as the net result of bonds breaking and new bonds forming. This activity allows students to determine the point of neutralisation by identifying the maximum temperature.
One problem with this experiment is that students don’t know when to stop adding the acid. After neutralisation, several further aliquots need to be added, even as the measured temperature falls. This allows learners to accurately draw the downward line-of-best-fit, with accurate extrapolation of the end point. Ask your students to split the work in their pairs – one collecting the data, the other recording and plotting the graph as they work (figure 1). They will see the graph develop and be able to better see when they have sufficient data. You can also data loggers to help with plotting as the experiment proceeds.
Questions to encourage your students’ understanding
- Why does the temperature rise?
- What is the significance of the extrapolated maximum temperature? Why is this not exactly the same as the highest measured temperature?
- Why does the temperature fall?
- What could you add to the setup to show explicitly that neutralisation occurred?
- How could you modify the setup to minimise heat loss to the surroundings even more?
- If you used sulfuric acid instead, what would the graph look like?
- Do you really need a burette for this activity? What else could you use?
Synoptic approach
Use further practical activities to explore other reactions and to help consolidate your students’ planning, practical and analysis skills. For example, investigate the reaction between a strong acid and magnesium metal instead of an alkali. Or investigate the effect of the carbon chain length of alcohols on heat energy released in the combustion of different alcohols. Ask your students to develop their own hypothesis and to test it.
Use further practical activities to explore other reactions and to help consolidate your students’ planning, practical and analysis skills. For example, investigate the reaction between a strong acid and magnesium metal instead of an alkali. Or investigate the effect of the carbon chain length of alcohols on heat energy released in the combustion of different alcohols (rsc.li/47nMgXz). Ask your students to develop their own hypothesis and to test it.
Some questions to get your students started:
- Which powdered metals will you investigate?
- Where are the metals positioned in the reactivity series?
- What equipment will you need?
- How could you minimise heat loss?
- What gas is given off?
- Explain how you would carry out each step in your investigation.
- Give details of all the experimental procedures and chemicals you need.
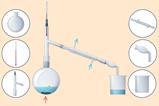
Monitoring reactions by the production of gases
There are several reactions that are gaseous producing, making monitoring the reaction possible. Counting bubbles isn’t accurate, so we use different methods to collect the gas. Demonstrate the catalytic decomposition of hydrogen peroxide with different catalysts using washing-up liquid in the solution. This allows a simple visual comparison of the volume of evolved gas.
There are several reactions that are gaseous producing, making monitoring the reaction possible. Counting bubbles isn’t accurate, so we use different methods to collect the gas. Demonstrate the catalytic decomposition of hydrogen peroxide with different catalysts using washing-up liquid in the solution (rsc.li/42MrnE8). This allows a simple visual comparison of the volume of evolved gas.
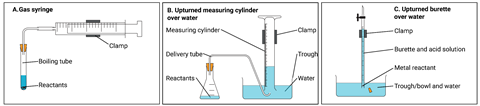
When you need a more quantitative approach to collecting gases, there are several options. These include using gas syringes, upturned measuring cylinders and an upturned burette over water (see figure 2). These gas collection vessels are interchangeable, but which method would your students choose for a particular activity? It depends upon the experiment, the measuring accuracy required, availability of equipment and upon the solubility of the gas evolving. If the gas is insoluble, students can collect it over water. If soluble, the gas syringe is more appropriate. Give your students lots of practice in different contexts to help them cope with an unfamiliar context that they may encounter in the future.
| Reaction mixture | Gas evolved | Suggested collection method |
|---|---|---|
| Magnesium + hydrochloric acid | Hydrogen | A, B, C (over water possible). C is the most accurate if this reaction is used to determine the volume of one mole of gas. |
| Zinc carbonate decomposition (heating) | Carbon dioxide | A is more accurate for measuring (as carbon dioxide is soluble in water). |
| Zinc + sulfuric acid | Hydrogen | A, B, C (over water possible) – a less familiar example of a metal + acid reaction. |
| Photosynthesis | Oxygen | B or could use any method, although slow. Normally inverted test tube over water to test gas but could be measured. |
Setting up the inverted measuring cylinder can be tricky, and messy. A simple method is to fold a piece of paper in half a few times, hold it firmly over the top of the filled measuring cylinder, then invert the cylinder into the half-filled trough. You can then remove the paper and reuse it in later repeats.
Colour changes
Many school practical activities use colour change, especially acid–base reactions involving indicators, such as titration. A common activity is the titration of a strong acid and strong alkali using a pH indicator. While the chemistry is quite clear, the practical process can be enormously challenging for some students. Moles and titrations: scary stuff looks at possible problems and solutions, and you can find more supporting resources on the Education website, including a possible homework task of a screen titration. This interactive simulation, with example contexts, allows students to gain familiarity and confidence with practical procedures to free up class time for developing practical skills. For example, they can learn the order of the steps they are taking and why: they can take readings, practise calculations and they can appreciate time savers such as not refilling the burette to the zero mark each time.
Colour changes of pH indicators for reactions of acids and bases, or clear solutions becoming opaque in rate experiments, can bring up the practical issue of judging the end point. You can find helpful tips in How to teach rate experiments and How to teach observation skills. Electrolysis experiments also monitor reactions by colour changes or gases produced, and this Practical electrolysis article will help you with practical problems and solutions.
Many school practical activities use colour change, especially acid–base reactions involving indicators, such as titration. A common activity is the titration of a strong acid and strong alkali using a pH indicator. While the chemistry is quite clear, the practical process can be enormously challenging for some students. The activity, ’Moles and titrations: scary stuff’ looks at possible problems and solutions (rsc.li/48HoXKO), and you can find more supporting resources on the Education website, including a possible homework task of a screen titration (rsc.li/3L16mzt). This interactive simulation, with example contexts, allows students to gain familiarity and confidence with practical procedures to free up class time for developing practical skills. For example, they can learn the order of the steps they are taking and why: they can take readings, practise calculations and they can appreciate time savers such as not refilling the burette to the zero mark each time.
Colour changes of pH indicators for reactions of acids and bases, or clear solutions becoming opaque in rate experiments, can bring up the practical issue of judging the end point. You can find helpful tips in the articles, ‘How to teach rate experiments’ (rsc.li/47cSOcV) and ‘How to teach observation skills’ (rsc.li/43tMcnS). Electrolysis experiments also monitor reactions by colour changes or gases produced, and the article, ‘Practical electrolysis’ will help you with practical problems and solutions (rsc.li/4orJYxp).
Morag Easson is a chemistry teacher in Scotland and a Royal Society of Chemistry trainer. David Paterson, an assistant head and a teacher of chemistry/physics, updated this article November 2025

Teaching practical science

Boost your confidence and your learners’ outcomes with these articles focused on practical lessons
- 1
- 2
- 3
- 4
 Currently
reading
Currently
reading
Monitoring reactions in practical chemistry
- 6
- 7
- 8


2 readers' comments