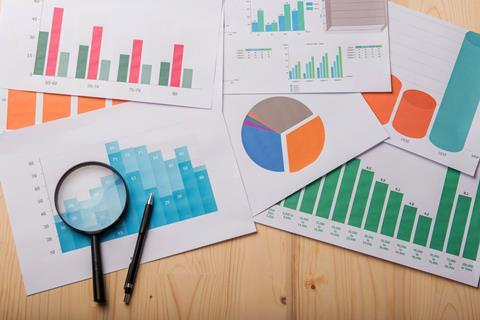
Help students to grasp the principles behind choosing the right data representation

This concept cartoon and worksheet will help students get to grips with choosing the appropriate presentation method for their data.
For tips on how to approach the teaching of this topic, read the Education in Chemistry article, Which graph when?
Downloads
Concept cartoon - understanding data
PDF, Size 0.24 mbConcept cartoon - understanding data
PowerPoint, Size 0.46 mbVariables worksheet
Word, Size 74.11 kbVariables worksheet
PDF, Size 85.29 kb


No comments yet