Use these ideas and tips to help your students better understand reaction kinetics and interpret graphs
Learners can develop a strong foundation in reaction kinetics and enhance their critical thinking skills by exploring Maxwell–Boltzmann distribution curves.
Working with these curves allows students the opportunity to apply mathematical concepts and carry out in-depth analysis of what they see on a graph. By practising this critical analysis of Maxwell–Boltzmann curves, students will better understand reaction kinetics and improve their ability to analyse quantitative charts in cross-curricular contexts, such as population distribution diagrams.
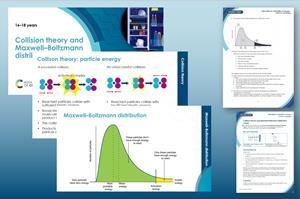
Download this
Lesson plan, presentation and student worksheet, for age range 16–18
Use this resource to recap collision theory before going on to introduce Maxwell–Boltzmann distribution curves.Resources include:
Download this
Lesson plan, presentation and student worksheet, for age range 16–18
Recap collision theory before going on to introduce the Maxwell–Boltzmann distribution.
Download the resource from the Education in Chemistry website: rsc.li/48dDsm0
Originally used to describe the distribution of speeds of particles in an ideal gas, the concepts defined by Maxwell–Boltzmann curves are now commonly applied in post-16 courses to further understanding of reaction rates, specifically the rate of reactions across changes in temperature and in the presence of a catalyst. This extends into the ideal gas law and real-world applications, such as the properties of refrigerants or controlling pollutants in energy production.
Interpretation of these diagrams also has broader chemical relevance, from spectroscopy to manipulating the conditions used for a reaction to increase productivity.
What students need to know
Before teaching Maxwell–Boltzmann curves, check that students have a sound understanding of the concept of temperature. Do they understand that temperature is a measure of the average kinetic energy of the particles in a substance and the effect changes in temperature will have on the kinetic energy?
Make sure students are familiar with collision theory concepts, including:
- the requirements for a successful collision (i.e. the minimum energy required to overcome the activation energy and correct orientation).
- the minimum amount of energy required to break bonds within reactant molecules depends on bond enthalpy values.
- the factors affecting rate (i.e. temperature, pressure, concentration, surface area and the presence of a catalyst).
You can consolidate much of collision theory when teaching Maxwell–Boltzmann curves by ensuring students have a sound understanding of the requirements for a successful collision and the practical methods of improving the odds of a successful collision.
Common misconceptions
Students commonly misinterpret Maxwell–Boltzmann curves, particularly what the area under the graph represents, as well as muddling Maxwell–Boltzmann curves with reaction profile diagrams.
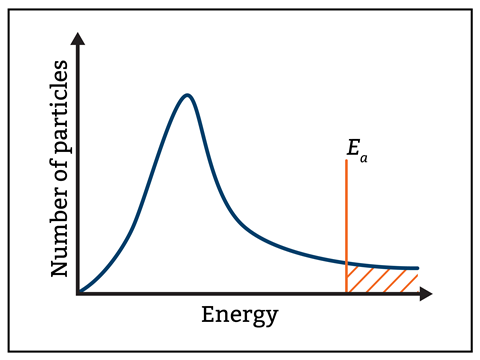
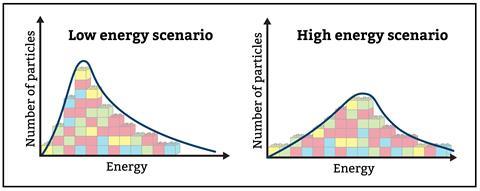
Encourage students to take the time to read axes labels and fully consider the data they are interpreting. Maxwell–Boltzmann curves, such as figure 1, show the number of particles on the y-axis and energy along the x-axis. Read What lies behind a graph? for more helpful tips on teaching distribution graphs.
Encourage students to take the time to read axes labels and fully consider the data they are interpreting. Maxwell–Boltzmann curves, such as figure 1, show the number of particles on the y-axis and energy along the x-axis. Read ‘What lies behind a graph?’ for more provides helpful tips on teaching distribution graphs (rsc.li/3BOLDua).
When teaching Maxwell–Boltzmann curves, analogies can help (see ‘Ideas for your classroom’, below). These analogies focus on the concept that the total area under the graph does not change and allow students to visualise the effect that changes to the reaction conditions have on the frequency of successful collisions. The latter is another area where students tend to lose marks, due to a lack of reference to overcoming the activation energy and the frequency of collisions when discussing these diagrams.
Ideas for your classroom
Before introducing Maxwell–Boltzmann curves, ensure your pupils are on the same page when interpreting population curves. A useful visual starter activity is to break out some Lego. Ask students to build a bar chart of energy versus number of particles (figure 2). An analogy can be useful. For example, they could plot the number of students (number of particles) in a playground and their energy levels. Some students might have been up all night and others had a good night’s sleep. What would happen if you gave all these students some sugar (representing energy and an increase in temperature) at break time? How would that change their bar graphs? By counting the bricks and verifying that each graph has the same number of bricks, this analogy helps students understand what the area under the Maxwell–Boltzmann curve represents.
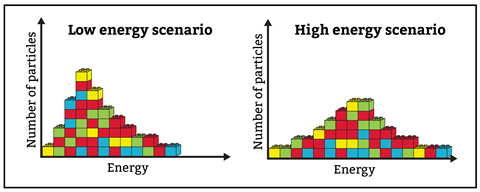
Before introducing Maxwell–Boltzmann curves, ensure your pupils are on the same page when interpreting population curves. A useful visual starter activity is to break out some Lego. Ask students to build a bar chart of energy versus number of particles. An analogy can be useful. For example, they could plot the number of students (number of particles) in a playground and their energy levels. Some students might have been up all night and others had a good night’s sleep. What would happen if you gave all these students some sugar (representing energy and an increase in temperature) at break time? How would that change their bar graphs? By counting the bricks and verifying that each graph has the same number of bricks, this analogy helps students understand what the area under the Maxwell–Boltzmann curve represents.
Expand the analogy with effective questioning. Let’s say that only students above a certain energy will positively interact. How can we represent this (activation energy) on the chart? How does the number of positive interactions change when you change the distribution of energies? What if a teacher entered the playground and encouraged more interactions (the catalyst)?
Then, draw the graph (figure 3) to make the model look like the more familiar Maxwell–Boltzmann curve, having weeded out any misconceptions on how to draw the curve in different situations.
Then, draw the graph to make the model look like the more familiar Maxwell–Boltzmann curve, having weeded out any misconceptions on how to draw the curve in different situations.
Alternatively, use a whiteboard to draw the blocks, or a piece of string pulled taut to represent energy changes to help students visualise the factors affecting the curve.
At this point, adapt the experiment, A visible activated complex. This activity recommends bringing the reaction to a temperature of 75°C but it will still work at 60°C. Set up two reactions side by side at slightly different temperatures to demonstrate the effect of temperature on the rate of a reaction and the visual formation of the activated complex. At the lower temperature, the green colour of the activated complex persists for longer.
You can use this to promote discussion with respect to Maxwell–Boltzmann curves, catalysts and to introduce reaction profile diagrams. Encourage students to compare and contrast the information presented in Maxwell–Boltzmann curves and reaction profile diagrams to avoid common misconceptions and help them tie the core concepts of collision theory together.
More resources
- The problem-based practical activity A little gas asks learners to use a simulation to explore the behaviour of particles in an ideal gas, before writing a magazine article about computer simulations in education.
- Use the Rates of reaction practical video to help learners link practical observations to theory.
- Find more assessment questions for this topic in our Kinetics starter for ten.
- Introduce your learners to Misbah, a senior principle scientist who uses computers to predict which catalyst will be best at removing pollutants from vehicles.
At this point, adapt the experiment, ‘A visible activated complex’ (rsc.li/3C4C4XO). This activity recommends bringing the reaction to a temperature of 75°C but it will still work at 60°C. Set up two reactions side by side at slightly different temperatures to demonstrate the effect of temperature on the rate of a reaction and the visual formation of the activated complex. At the lower temperature, the green colour of the activated complex persists for longer.
You can use this to promote discussion with respect to Maxwell–Boltzmann curves, catalysts and to introduce reaction profile diagrams. Encourage students to compare and contrast the information presented in Maxwell–Boltzmann curves and reaction profile diagrams to avoid common misconceptions and help them tie the core concepts of collision theory together.
More resources
- Download this problem-based practical activity A little gas and ask learners to use a simulation to explore the behaviour of particles in an ideal gas, before writing a magazine article about computer simulations in education: rsc.li/4fGcqXX
- Use the Rates of reaction practical video to help learners link practical observations to theory: rsc.li/3YJCUB9
- Find more assessment questions for this topic in our Kinetics starter for ten: rsc.li/3YfO941
- Introduce your learners to Misbah, a senior principle scientist who uses computers to predict which catalyst will be best at removing pollutants from vehicles: rsc.li/40DBlr2
Checking for understanding
Knowledge gained from successful understanding of Maxwell–Boltzmann curves is far reaching in reaction kinetics. Formatively assess students’ knowledge by asking them to draw and fully annotate an Maxwell–Boltzmann curve under different scenarios on a mini whiteboard and show you. Probe students’ knowledge on the Maxwell–Boltzmann curves using the Starter for 10 on kinetics, a ready-made resource for assessment. It is worth noting that this knowledge is not limited to chemistry. Students can apply the skills developed in critically analysing these graphs to many other curriculum areas.
Knowledge gained from successful understanding of Maxwell–Boltzmann curves is far reaching in reaction kinetics. Formatively assess students’ knowledge by asking them to draw and fully annotate an Maxwell–Boltzmann curve under different scenarios on a mini whiteboard and show you. Probe students’ knowledge on the Maxwell–Boltzmann curves using the ‘Starter for 10 on kinetics’, a ready-made resource to use as assessment (rsc.li/3YfO941). It is worth noting that this knowledge is not limited to chemistry. Students can apply the skills developed in critically analysing these graphs to many other curriculum areas.
Take-home points
- Use analogies and point out the wider applications of Maxwell–Boltzmann curves to capture students’ interest.
- Manipulating reaction rates is very topical. Offer students the opportunity to investigate industrial applications and green chemistry.
- Teach students to use specific language when discussing Maxwell–Boltzmann curves; concisely referring to the energy required to overcome the activation energy, the effect of various factors on the frequency of successful collisions and the effect of a catalyst.
- Give students plenty of practice interpreting these diagrams so they develop the tools to successfully interpret both Maxwell–Boltzmann curves and similar diagrams in other subjects.
Article updated with new figure 1 on 3 December 2024.
Article written by Matthew Wilson, a chemistry teacher at St Thomas of Aquin’s High School. Resource written by Dorothy Warren, a science education consultant





1 Reader's comment