

Steve Hacker explains how the concept of reaction rates could be introduced
The concept of speed or rate as the change in a measured quantity per unit of time is readily understood by most children. For example, if a car travels at 50 km h-1, it is simply stating that in 1 hour, a distance of 50 km is travelled.
In science lessons, most students encounter the idea of rate when exploring the rate of dissolving in simple practical activities. They invariably use a clock of some description and make observations regarding the ‘disappearance’ of a material. They may be encouraged to consider the effect of temperature on the rate of dissolving or the effect of particle size. This enables the collection of data and allows students to demonstrate a quantitative as well as a qualitative approach to this practical activity.
However, in chemical reactions, the challenge for most students is first to understand what is meant by chemical change. One typical reaction to explore at secondary level is the rate of the reaction between magnesium ribbon and hydrochloric acid. The instructions on a worksheet may state ‘time how long it takes for the magnesium to disappear’. This is unhelpful if we are trying to teach the concept that a chemical reaction is taking place. The language we use to describe chemical change is vitally important and even in a previous issue of Education in Chemistry, copper has been described as dissolving in nitric acid rather than reacting with nitric acid. Asked to state what is happening at the surface of the magnesium, many students will struggle as the concept of particle collisions is not well understood.
What students find tricky
1. Understanding what chemical change is
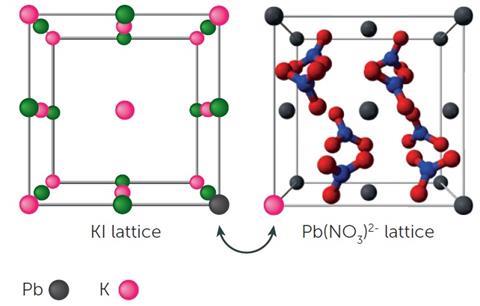
As David Read explains, the challenge for many students is switching between macroscopic, sub-microscopic and symbolic representations. This can be described as the ‘chemical triplet’. Balanced chemical equations are often used with students when describing a chemical change. They are a representation of what is taking place and act as a summary of what might occur or what has occurred. For example, students can conduct a simple experiment to explore the reaction between solid lead nitrate and potassium iodide by adding equal quantities of the reactants. The reaction observed can be represented as follows:
Pb(NO3)2(s) + 2KI(s) → 2KNO3(s) + PbI2(s)
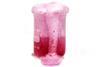
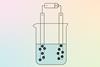
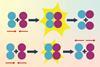
However, this summary does not aid their understanding of what might be taking place at a molecular level and the idea of ions making contact with each other on a reacting surface and ‘partner swapping’ (see diagram), which leads to the formation of the yellow lead iodide, needs to be conveyed. Students may not necessarily see that contact between species is key. This shows what might be taking place at a sub-microscopic level. This may be more clearly and more rapidly observed in a solution in which a yellow precipitate is formed. A demonstration is given here. Students can be asked about why the reaction is more rapid in solution compared to a solid/solid reaction.
Evidence of what is happening at a macroscopic level is gathered through conducting such practical activities. Tackling the idea of particles colliding, using models and making links between the three aspects of the chemical triplet will aid understanding later.
In general, in a chemical reaction:
- reactants are converted into products (this is more clearly grasped if students understand the particle model) – sub-microscopic
- reactants collide → bonds break → atoms rearrange → new bonds form → products are created – sub-microscopic and macroscopic
- no atoms are lost or made (mass is conserved) – macroscopic
- the change can be summarised in an equation – symbolic representation
2. Energy and what makes a successful collision
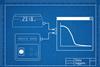
Chemical reactions only occur when reacting particles collide with sufficient energy (and in the correct orientation) to break bonds. The energy that the reactants need in order to collide successfully is called the activation energy, Ea. If we were to represent the energy profile of a successful reaction between hydrogen and chlorine gas (H2 + Cl2 → 2HCl), it might look something like Figure 1.
Students need to appreciate that here the reactants have sufficient energy to equal or exceed the activation energy so a reaction occurs. It is therefore worth stressing to students that while the above profile will be true for a successful change, energy profiles of unsuccessful reactions might look like Figure 2.
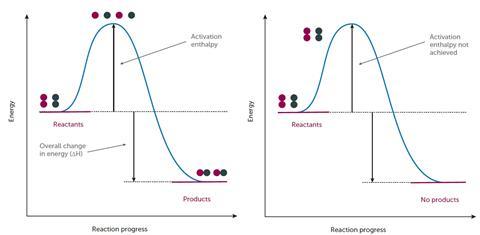
Here, the reactants do not have sufficient energy to react so the activation energy is not achieved, successful collisions do not occur and no products are formed. Therefore, any change in conditions that leads to an increase in the proportion and frequency of ‘successful collisions’ will increase the rate of a reaction.
A catalyst works by providing a different mechanism that requires a lower activation energy for the reaction to proceed. Catalysis will be dealt with in more depth in a later article.
The reaction between hydrogen and chlorine is an interesting one to discuss with students as the energy required to react is provided by light rather than heat. A video resource of this can be found here (from 10:28).
Most textbooks and revision guides might list factors that can be used to control the rate of a reaction (see Table 1).
| The rate of a reaction can be increased by: | Supporting RSC resource |
|---|---|
|
Increasing the surface area of a solid reactant |
|
|
Increasing the concentration of a reactant in solution |
Reaction of sodium thiosulfate and acid |
| Increasing the pressure of a gaseous reactant | Increasing the pressure is effectively the same as increasing the concentration. Note that many examples involving gases, such as the Haber and Contact processes, also involve an understanding of equilibria so resources need to be chosen carefully so as not to confuse students. |
| Increasing the energy (heat) | Reaction of sodium thiosulfate and acid |
| Increasing the energy (light) | Reaction between chlorine and hydrogen |
| Deploying a catalyst | A visible activated complex |
Note that what is often not explained in the first three instances is that there is an increase in the frequency of collisions but not a change in the number of reactant species that have energy equivalent to, or greater than, the activation energy, Ea. As the frequency of collisions increases, a greater proportion of the collisions will have sufficient energy.
3. The concept of particle size
Developing the idea of surface area to volume ratio can aid understanding, which is typically something students find difficult. In one such activity, students repeatedly cut a plasticine block into smaller and smaller pieces (see Developing maths skills below). The key teaching point is that the mass of the original ‘reactant’ has not changed but the surface area has increased fourfold at each stage of cutting. If we continue this logic, students should see that by constantly dividing up the ‘reactant’ particle, the surface area available to react increases. The end point of these divisions would be at a molecular level as they would be found in liquid, aqueous or gaseous form. This is the ultimate ‘small particle’ to ensure a rapid rate of reaction.
4. The link between activation energy and rate
Increasing the temperature changes the distribution of energy in a system and more reactant species have energy equivalent to, or higher than, Ea. The frequency of successful collisions is thus increased (Figure 3).
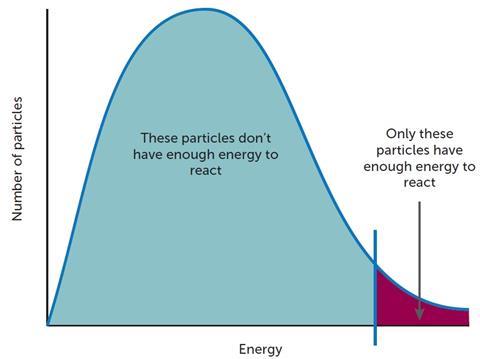
At this stage, one might introduce the Maxwell–Boltzmann distribution but care needs to be taken as this may cause confusion in students’ minds with the energy profile diagram (Figure 1). More able students may be able to see that if a catalyst is deployed and it provides a mechanism that requires a lower activation energy then there will be a greater proportion of particles with sufficient energy to react successfully.
While typically, manganese(iv) oxide is used to show the catalytic decomposition of H2O2, many students do not appreciate that the catalyst takes an active part in the reaction mechanism. Since the reaction involving Rochelle salt, H2O2 and cobalt chloride (a visible activated complex) shows the change in oxidation state of cobalt in the oxidation of sodium potassium tartrate by H2O2, students can clearly see the cobalt is actively involved in the reaction mechanism. They can also appreciate the reaction occurs only slowly until the catalyst is added.
Different experimental methods can be used to monitor reactions and explore the rate. Typically, pre-16 students carry out the practicals listed in Table 2.
| Practical investigation | Method to measure rate |
|---|---|
| Magnesium and acid |
Volume of gaseous product versus time |
|
Calcium carbonate and acid |
Volume of gaseous produced versus time Mass loss of reactants versus time |
|
Sodium thiosulfate/acid precipitation reaction (this practical lends itself to the use of a datalogger and light probe if available) |
Set amount of product versus time |
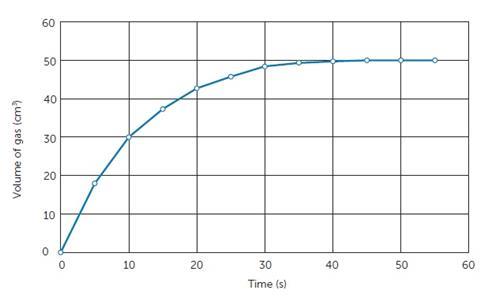
Some students may have difficulties carrying out these practical procedures with gas often being collected in upturned measuring cylinders by displacement or judging the disappearance of the black cross, so these may be areas that require practice. The graph generated might look something like Figure 4.
With the first two examples, students can gather data and plot graphs. This needs to be done manually if they are to develop the skill of determining initial rate by drawing tangents to the line (see Developing maths skills below).
Suggested teaching sequence
What is chemical change
- Chemical reactions involve rearrangement of atoms
- No atoms are destroyed or made – mass is conserved
- Chemical change happens around us all the time; some changes are very slow, whereas others happen more rapidly
- Reactant species need to collide successfully for change to occur
Factors affecting rate
- Particle size – via an exposition of surface area to volume ratio
- Smallest particle is at a molecular scale
- Apply collision theory to concentration and pressure
- Apply idea of activation energy to catalysts
Measuring rate and handling data
- The rate of a chemical reaction is a measure of the amount of product formed in a given time (or the amount of reactant used up in a given time)
- Different experimental methods can be used for monitoring reactions and finding out information about the rate (continuous monitoring, initial rate)
- Practise reading rates from graphs and calculating the rate at specific times using tangents
Summary
The study of reaction rates can be difficult for many students and yet the concept that rate can be controlled is key in all aspects of chemistry in the lab and in the world around us. It is essential to ensure that, as educators, we use the correct terminology and appropriate models so we provide the best building blocks that allow the development of concepts such as reaction mechanisms and more complex situations that will be encountered at a higher level of study.
Resources
- Reaction between solid lead nitrate and potassium iodide
- Maths for chemists
- A visible activated complex
Developing maths skills
Rate is a ratio
The idea that the rate of a reaction simply describes the ratio between one quantity and another is worth expanding with some students. Rate can be expressed as:
rate = evolution of product/time
If the rate of a reaction is 10 cm3 of CO2 per minute, students should be encouraged to consider that if the rate remained constant, how much product would be produced in 5 minutes, 10 minutes or 30 seconds?
Investigating the surface area to volume ratio
This practical activity is helpful in developing an understanding of the effect of particle size on surface area. In this example, students use a block of plasticine to represent a large particle of reactant material. (This can be linked to the marble chips and acid experiment if they have already done it.)
- Students take a cube of plasticine 8 cm x 8 cm x 8 cm
- Calculate the volume = 8 x 8 x 8 = 512 cm3
- Calculate the total surface area = 8 cm x 8 cm x 6 sides = 384 cm2
- Using a knife or the edge of a ruler, cut the block into eight separate blocks measuring 4 cm x 4 cm x 4 cm
- New surface area of one block is 4 x 4 x 6 = 96 cm2
- So the total surface area is 8 blocks x 96 = 768 cm2
Students should be able to see that the surface area has increased considerably - Now cut one of the 4 cm blocks into 2 cm x 2 cm x 2 cm blocks. This creates eight new smaller blocks
- Surface area of one block = 2 cm x 2 cm x 6 sides = 24 cm2
- Surface area of eight blocks is 24 x 8 = 192 cm2
- Students need to imagine this repeated for all the other 4 cm blocks
- Total new surface area 192 x 8 = 1536 cm2
- Students could now be asked to deduce a mathematical relationship by either drawing graphs or proposing an expression
Determining rate using tangents and gradients
One of the difficulties experienced by students is the determination of rate by drawing a tangent to the curve on a graph and using the gradient to determine rate. In the GCSE specifications, to be taught for the first time in September 2016 with increased mathematical demand, students are expected to be able to do this for both initial rate as well as rates at specific times during the reaction.
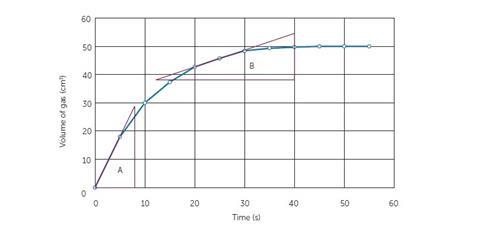
In the example (Figure 5), the tangents have been drawn to the line. The triangles constructed subsequently will allow students to calculate the gradient. Triangle A will allow the calculation of initial rate while B will allow the calculation of rate at 25 seconds. Students will need to be formally taught this procedure. It is suggested that you consult your school’s maths department to find out when and where this is done in maths lessons so that you can be consistent with the language you use.
Steve Hacker is a Royal Society of Chemistry trainer and independent science education consultant
More CPD
The Royal Society of Chemistry’s Developing Expertise in Teaching courses are designed to support you throughout your teaching career. Practical work is an integral part of all face-to-face workshops.
Find out more about the CPD for Teachers courses on offer.

2 readers' comments