Everything you need to help your students see spectroscopy in a new light

Spectroscopy is the study of the interaction of light and matter. The discovery of how to determine the structure and properties of matter using light over the past two centuries has revealed the sub-microscopic realm. In our everyday lives, for example, spectroscopy allows police officers to accurately test blood alcohol content at the roadside. They analyse breath samples using infrared (IR) spectroscopy in a handheld device. At its most complex, spectroscopy provides an atomic level map of the structure of proteins and how drug molecules interact with them. For example, the Diamond Light Source synchrotron in Didcot, which cost around £260 million to build, was central to solving the structures of proteins in the SARS-CoV-2 virus and in the search for novel drugs to treat the disease it causes, Covid-19.
What students need to know
The electromagnetic (EM) spectrum ranges from low-energy radio waves and microwaves to high-energy X-rays and gamma rays. When a photon (the particle of EM radiation) interacts with matter, the matter absorbs the energy and a change occurs. In nuclear magnetic resonance (NMR) spectroscopy, the spin of atomic nuclei flip from being aligned with the external magnetic field to being aligned against it. In ultraviolet-visible (UV-vis) spectroscopy, electrons in atoms or molecules are promoted from lower energy levels to higher energy levels. In IR spectroscopy, the vibrations of molecules increase from lower energy levels to higher energy levels. In all cases, the energy level of the matter is quantised, meaning it can only exist at fixed levels. Therefore, only photons with energy equal to the difference between energy levels can be absorbed and reemitted. Spectra show a series of peaks related to the energy of the photons absorbed (or released once the matter emits energy). Databases link peak values with structural elements, giving us insight into the overall structure of the matter being analysed.
Common misconceptions
Some students see individual structural elements as being isolated in molecules. This misconception develops early on when students study IR spectroscopy, and single wavenumbers are used to describe a particular bond. The molecular environment surrounding an individual bond changes the energy levels of that bond. For example, a carbonyl in an aldehyde absorbs IR at a lower wavenumber than one in an acyl chloride. In post-16 structural analysis, students have to process broad ranges of values supplied in datasheets. It is important for students to integrate all the data available when determining a structure to ensure they don’t make impossible suggestions. For example, if the empirical formula of the substance shows the presence of only carbon, hydrogen and oxygen, then acyl chloride is not a possibility.
The quantity of information in spectra rapidly increases with the complexity of the molecules, and students can become overwhelmed
The general misconception that matter is static at the atomic level can hinder understanding of how EM radiation interacts with matter. This misconception develops when we draw chemical structures with fixed angles and straight lines. Even when we move to 3D diagrams – for example, showing methane in a tetrahedral arrangement – students struggle to imagine continual fluctuations in the relative position of the hydrogen atoms. You can use this fascinating collection of animations from Purdue University to show the huge variety of vibrational modes of even the simplest molecules.
The general misconception that matter is static at the atomic level can hinder understanding of how EM radiation interacts with matter. This misconception develops when we draw chemical structures with fixed angles and straight lines. Even when we move to 3D diagrams – for example, showing methane in a tetrahedral arrangement – students struggle to imagine continual fluctuations in the relative position of the hydrogen atoms. You can use this fascinating collection of animations (bit.ly/3GHGItQ) from Purdue University to show the huge variety of vibrational modes of even the simplest molecules.
Download this
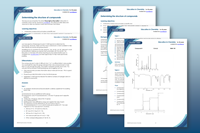
Scenario and spectra practice, for age range 16–18
Provide your learners with a concrete analytical chemistry example and seven compounds’ spectra to interpret.
Download the student sheet and teacher notes from the Education in Chemistry website: rsc.li/3Xq0sbZ
Ideas for your classroom
Interpreting spectra accurately is a key step in structure determination and requires patience and practice. You can use myriad past paper questions from the exam boards, but there are some spectra that may be missing for copyright reasons. There are many other free sources of spectra. Students benefit from lots of practice when first learning to interpret spectra (massed practice) and then regular short practice sessions over time (distributed practice). Some sources I frequently use are:
- The Knockhardy website, with concise and detailed notes about spectroscopic theory, and a wide range of NMR spectra to interpret.
- The Spectral database for organic compounds download contains UV-vis, IR and NMR (and many other) spectra of a wide range of organic compounds.
- Synthesis explorer is a website linking synthetic transformations of organic substances with 3D models and NMR and IR spectra.
Interpreting spectra accurately is a key step in structure determination and requires patience and practice. You can use myriad past paper questions from the exam boards, but there are some spectra that may be missing for copyright reasons. There are many other free sources of spectra. Students benefit from lots of practice when first learning to interpret spectra (massed practice) and then regular short practice sessions over time (distributed practice). I frequently refer to the Knockhardy website (bit.ly/3kbon0z), with concise and detailed notes about spectroscopic theory, and a wide range of NMR spectra to interpret. I also find the Spectral Database for Organic Compounds (bit.ly/3IQQmwy) useful – it contains UV-vis, IR and NMR (and many other) spectra of a wide range of organic compounds. Synthesis Explorer (bit.ly/3CHlk6q) is another website linking synthetic transformations of organic substances with 3D models and NMR and IR spectra.
Be selective in which substances you introduce students to early on. The quantity of information in spectra rapidly increases with the complexity of the molecules, and students can become overwhelmed. This is why I particularly like the set of NMR spectra from Knockhardy. They build up the complexity of molecules slowly over the 16 spectra, from a simple haloalkane to a diketone.
More resources
- Watch this practical video with your 16–18 learners to link structure determination and testing for organic functional groups.
- Highlight a possible career pathway in analytical chemistry with this job profile from Christopher, an NMR spectroscopist.
- Use this Starter for 10 on analysis to revise mass spectrometry, isotopic abundance, infrared spectroscopy and more.
- Show your learners this collection of videos on a range of spectroscopic techniques for pre-lesson tasks or consolidation after teaching new theory.
The RSC Spectroscopy in a suitcase project information and work booklet is also an excellent stand-alone resource. There are details of the workings of the major spectroscopic techniques, along with spectra to interpret. The RSC’s Modern chemical techniques book goes into even more detail.
You can introduce interesting contexts by using resources such as the New drugs for old project. Students have a wide range of data, including spectra, to analyse and evaluate. The spectra can be used as stand-alone resources for practising spectra analysis, or the whole project used to develop students’ transferable skills.
The RSC Spectroscopy in a suitcase project information and work booklet (rsc.li/3GzjwxC) is also an excellent stand-alone resource. There are details of the workings of the major spectroscopic techniques, along with spectra to interpret. The RSC’s Modern chemical techniques (rsc.li/3vYzYTm) book goes into even more detail.
You can introduce interesting contexts by using resources such as the New drugs for old project (rsc.li/3X7dBa2). Students have a wide range of data, including spectra, to analyse and evaluate. The spectra can be used as stand-alone resources for practising spectra analysis, or the whole project used to develop students’ transferable skills.
Checking for understanding
Students can get good at spectra interpretation without necessarily understanding how the spectra come about. You can assess how much they understand about the underlying concepts by having detailed discussions with them. With larger classes, one-to-one discussions can be harder, so consider setting writing tasks. For example, ask students to write some concise explanations. You could ask them to explain why the hexaaquacopper(II) complex is blue or why single bonds generally have higher IR wavenumbers than double bonds. Or you could ask about the correlation between the electronegativity of adjacent atoms and the chemical shift of hydrogen nuclei in NMR spectra.
Take-home points
- Spectroscopy is the study of the interaction between light and matter, covering techniques such as UV-vis, IR and nuclear magnetic resonance spectroscopy.
- Individual structural elements, such as a nuclei, a chemical bond or a delocalised electron, are affected by the local chemical environment, causing differences in the energy of the photons absorbed.
- Make use of the wide range of free high-quality spectra available to give your students plenty of practice in spectra analysis.







No comments yet