Andy Extance discovers how urban air pollution monitoring is changing to protect our health

Specification links
Download a list of specification points this article supports from the Education in Chemistry website: rsc.li/EiC318air
When Prashant Kumar found out an invisible enemy was harming him, he didn’t start questioning his sanity – he made a career out of fighting that foe. Studying at the Indian Institute of Technology, Delhi, he learned there were grains of ‘particulate material’ floating in the air around him, too tiny to see. ‘At that time I was not very aware that these things you can’t see can have a huge impact on your health,’ says Prashant. He now runs the Global Centre for Clean Air Research at the University of Surrey in Guildford, UK.

In your class
Download the text of this article (MS Word or pdf), all the teaching ideas as a single file (MS Word or pdf), or all the downloads in one zip file (MS Word or pdf).
Air pollution is commonly included in exam specifications. Air pollution illustrates the impact of chemistry and shows how human activity can affect our planet. This article provides an up to date perspective on an old problem and the key concepts recur in a number of different core topics.
Air pollution is commonly included in exam specifications. Air pollution illustrates the impact of chemistry and shows how human activity can affect our planet. This article provides an up to date perspective on an old problem and the key concepts recur in a number of different core topics. The article itself is a useful stimulus for discussion of the chemical and geographical factors that affect the extent of urban air pollution. The classroom resources described here provide a range of activities to support the teaching of concepts linked to air pollution such as combustion experiments, equations for the generation of air pollutants and ‘citizen science’ type science club activities.
Download the text of this article, and all the related teaching resources described on these pages – as pdfs or word documents – from the Education in Chemistry website: rsc.li/EiC318air

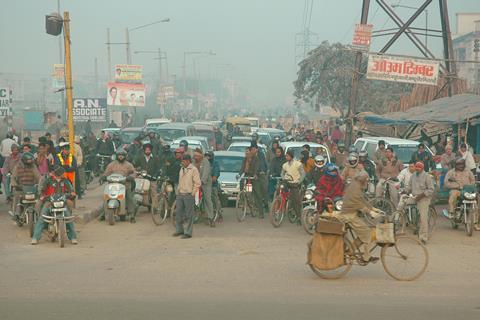
While the threat remains largely invisible, pollution’s effects in Delhi have become ever more obvious. On 5 December, 2017, the city’s pollution caused players to vomit during a cricket match between India and Sri Lanka, stopping play. In winter, Delhi’s problem is literally a burning issue. Outside the city, farmers burn waste straw. Inside, people burn wood and cow dung to keep warm and cook. And of course, more fossil fuel-burning cars are polluting the air year round, as they are everywhere in the world.
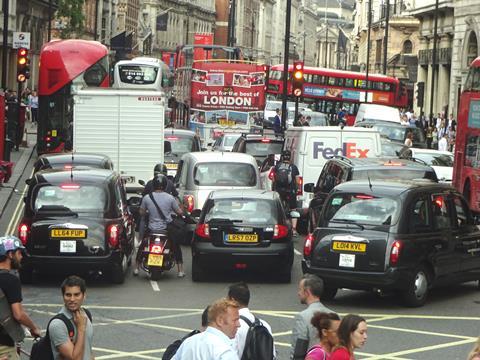
In the UK too, air pollution has become a big issue, with London often breaking legal limits set by England’s Air Quality Standards Regulations 2010. In April 2017, a group of MPs from different parties called UK air pollution a ‘public health emergency’. The European Environment Agency estimates air pollution is responsible for more than 400,000 premature deaths annually in Europe. How could this happen? Have those we entrust with our health overlooked chemicals in the air around us?
Priorities up in the air
Over recent decades, there has been a steady shift in which pollutants are in the air, and which ones we pay attention to, Prashant explains. ‘If you look back there was a time when sulfur dioxide was a big issue, from burning sulfur-containing coal,’ Prashant underlines. As well as dissolving to create acid rain that can damage trees and buildings, sulfur dioxide reacts to helps create smog. In the early 1950s a five-day Great Smog was directly linked to the deaths of over 4000 Londoners. Driven by this, the UK passed the Clean Air Act in 1956, tackling smoke and sulfur dioxide, from which point the country’s air pollution has diminished.

Incomplete combustion
Demonstration, all ages
The chip pan fire demonstration is popular with pupils of all ages. It shows students that heat, fuel and oxidant are required to keep a fire burning. It can also demonstrate that combustion can lead to particulate matter entering the air. The oil burns with an orange, smoky flame, indicating incomplete combustion. A test tube passed through the flame will blacken with soot (particulate carbon).
The chip pan fire demonstration is popular with pupils of all ages. It shows students that heat, fuel and oxidant are required to keep a fire burning. It can also demonstrate that combustion can lead to particulate matter entering the air. The oil burns with an orange, smoky flame, indicating incomplete combustion. A test tube passed through the flame will blacken with soot (particulate carbon). Find a video, the instructions and the technician notes for this demonstration at rsc.li/EiC517ec
Since then, as sulfur dioxide levels fell, other pollutant foes have become more obvious. One key type is particulate matter, or PM, usually written with a number indicating the particles’ size. PM10 particles are below 10 µm in diameter. PM2.5 are those below 2.5 µm in diameter. For comparison, a human hair is typically 50–70 µm wide.
PM is a complex mixture of substances that get lodged in people’s lungs, and are linked to heart and lung diseases, Prashant explains. It is mainly produced in three ways. Some particles are released during burning, including in car engines. Others come from dusty materials found on surfaces like roads, like worn fragments of tyre. Finally, some are made in reactions between chemicals in the air, including sulfur dioxide and nitrogen oxides (NOx), and volatile organic chemicals.

Combustion equations
Differentiated worksheet, ages 14–16
Writing equations for combustion processes is a key skill and can be very challenging for pupils. Pupils need to be able to balance such equations and to construct them from descriptions, taking note of the clues within the questions such as ‘poisonous gas’ and ‘solid pollutant’.
Download the foundation worksheet (MS Word or pdf); the higher worksheet (MS Word or pdf); the knowledge organiser (ppt or pdf); and the teacher answer sheet (MS Word or pdf).
The article provides context for revisiting the chemistry of combustion. Writing equations for combustion processes is a key skill and can be very challenging for pupils. It is a popular topic for examining constructing and balancing equations. Pupils need to be able to balance such equations and to construct them from descriptions, taking note of the clues within the questions such as ‘poisonous gas’ and ‘solid pollutant’. The worksheets downloadable from the Education in Chemistry website are differentiated to provide increasing challenge for pupils. Use the knowledge organiser provided alongside the combustion equations activity to support lower achieving pupils.
Like the UK, India has clean air standards to tackle air pollution, Prashant adds. Delhi has problems with PM partly because it is an inland city without the benefit of coastal winds, with lots of pollution sources. Delhi’s problems are also partly due to how it deals with pollution, he explains. ‘In London you see a lot of activity not only from the government side, but also from environmental and professional groups that feed into the policies, highlighting issues and solutions.’ Governments in countries like India are less receptive to this kind of feedback, he adds.

Which is the best fuel?
Differentiated experiment, ages 11–14 and 14–16
In this experiment, pupils compare different fuels and consider factors that might be important in choosing the best fuel. It is differentiated for younger and older pupils.
Download the foundation experiment (MS Word or pdf); the higher experiment (MS Word or pdf); and the teacher notes (MS Word or pdf).
Experiments that involve burning things are always popular with pupils. In this experiment downloadable from the Education in Chemistry website, pupils compare different fuels and consider factors that might be important in choosing the best fuel. It is differentiated for younger and older pupils. Younger pupils consider their observations, draw conclusions and begin to evaluate how the experiment can be improved. For older pupils the activity involves more measurement and touches on the foundations of calculating energy changes using the equation q = mcΔT.
In the UK, PM2.5 levels have fallen less steadily than sulfur dioxide and PM10. Together with NOx pollution, PM2.5 levels started rising again in the early 1990s, before control efforts succeeded in reducing them to their current all-time-low overall levels. Yet that success has recently faced a setback. In September 2015, German carmaker Volkswagen Group admitted that it temporarily artificially lowered PM2.5 and NOx emissions while diesel cars were tested for compliance with environment laws. When tested in normal use, their NOx emissions are four times the European limit, and 11 million cars sold between 2008 and 2015 are affected. Researchers found that the 2.6 million affected cars in Germany alone could cause 1200 early deaths in Europe.
Driving into the wild blue yonder
Yet the story that study told about the impact of NOx is complex, as is almost everything about these gases. Usually, nitrogen is too stable to react with oxygen. But at high temperatures, like those in car engines, they can combine to produce a variety of molecules, including NO and NO2. On sunny days NO2 in particular breaks down in a photochemical reaction. This leads to a mazy network of reactions that form other substances, including ozone. Like PM, ozone can cause lung and heart damage if inhaled. However, NO also reacts with and removes ozone from the air, and NO accounts for more than four-fifths of NOx emissions from diesel vehicles. Therefore, the scientists looking at the Volkswagen scandal’s effects found that, thanks to NO removing ozone, increased NOx emissions actually reduced the harm caused by increased PM2.5 emissions.

How catalysts reduce emissions
Video resources, ages 11–14, 14–16, 16–18
These video resources cover the role of catalysts in reducing harmful emissions. There are three videos, one for each age range.
These video resources found on Learn Chemistry cover the role of catalysts in reducing harmful emissions. There are three videos, one for each age range: rsc.li/LCcatalysis
The Volkswagen scandal may have harmed official efforts to deal with pollutants such as PM2.5 and NOx originating from cars, says Prashant. Scientists produce computer models to help governments with their plans. ‘But when Volkswagen was cheating on their emissions, these predictions will be off,’ he explains. The scandal undermined scientists’ work to protect people.
Everyone is affected by short-term exposure to high levels of pollutants, and long-term exposure to lower levels
To enable people to take steps to protect themselves, Prashant’s team has studied exposure to pollution while driving. ‘We found that when you’re at traffic lights or in a congested environment you get the highest exposure, but exposure is also driven by the choices you make,’ he explains. ‘If you keep your windows open at a traffic light you can expect a lot more emissions coming into your car. Or, if your windows are closed but you’re sucking fresh air from outside at those congested places, you’re sucking fumes inside. If you circulate air rather than taking the fresh inlet, and keep windows closed, that can reduce your exposure.’
Everyone is affected by short-term exposure to high levels of pollutants, and long-term exposure to lower levels, stresses Vivien Bright, who works on air quality at the Met Office in Exeter, UK. She notes that healthy people don’t normally feel any instant effect from moderate air pollution. However, it can cause problems for the elderly and younger people with medical conditions, especially lung and heart problems. That includes asthma, which Vivien has.
NO2-toriously dirty

Although London air sometimes breaches legal NO2 limits, Vivien emphasises this only happens in a few unusual places. For example, measurements made in shopping hotspot Oxford Street in 2013 apparently showed the highest NO2 levels in the world. ‘A significant amount of buses and taxis go through Oxford Street,’ Vivien explains, traditionally powered by notoriously dirty diesel engines. The tall buildings on either side of this street also make it a ‘street canyon’. ‘It’s poorly ventilated and pollutants can build up,’ Vivien says. Some studies have shown that the city’s efforts to replace polluting diesel-powered buses and taxis with cleaner electric models have cut NO2 levels in the worst streets, she adds.
Science club investigation, ages 11–14, 14–16
Measuring particulates in the air is an excellent ‘citizen science’ project that can be carried out over a number of weeks by a science club. A cross-curricular approach involving maths and geography could involve making plans of the school grounds before deciding on suitable sites for testing. In this activity microscope slides are used to collect particulate air pollution. The activity could be extended beyond the school grounds with pupils taking home slides to put in their gardens. These can then be brought back to school to compare with the results gained on school sites.
Measuring particulates in the air is an excellent ‘citizen science’ project that can be carried out over a number of weeks by a science club: bit.ly/2H60w9N. A cross-curricular approach involving maths and geography could involve making plans of the school grounds before deciding on suitable sites for testing. In this activity microscope slides are used to collect particulate air pollution. The activity could be extended beyond the school grounds with pupils taking home slides to put in their gardens. These can then be brought back to school to compare with the results gained on school sites.
By contrast, Vivien says, Delhi’s general PM problems dwarf London’s. In November 2017, PM2.5 levels in Delhi reached 700 µg m-3, and in January 2018, when Vivien spoke to Education in Chemistry, at one site they were still 400 µg m-3. Vivien compares this to the UK Daily Air Quality Index (DAQI), the pollution forecast that the Met Office provides daily forecasts for. The most polluted level the DAQI reaches, ‘Very high’, starts at 71 µg m-3, just one-tenth of Delhi’s November 2017 level. ‘We rarely see very high levels in the UK,’ Vivien comments. ‘If we did, they’d be isolated. I had a quick look at central London this morning, and there’s not much pollution around – currently 12.5 µg m-3 for PM2.5.’
The wet, windy conditions in the UK that morning helped keep pollution down, mixing the atmosphere and stopping pollutants from reaching high levels. Rain also dissolves and otherwise washes gases and PM out. And because the wind was coming from the west, over the Atlantic Ocean, the air is much cleaner than when the UK gets winds from the east, blowing in pollution from Europe. ‘If you have air coming down from the Arctic, that’s again very clean,’ Vivien says. ‘Sometimes high winds import pollutants from further afield,’ she adds, as well as natural dust from the Sahara Desert, and recently smoke from wildfires in Portugal.
Surprisingly, there is often more ozone in the air in rural areas as there is less NO for it to react with
The place in the UK with the worst air quality on that morning was the Shetland Islands, to the north of Scotland. Its ozone levels had reached the moderate rating of 101–120 µg m-3. Surprisingly, there is often more ozone in the air in rural areas as there is less NO for it to react with than in urban areas.
The Shetlands’ ozone shows up strikingly as a lone yellow marker on the interactive UK-AIR map produced by the UK’s Department for the Environment, Food and Rural Affairs (Defra). Vivien’s team combines that data with the Met Office’s weather models to produce daily pollution forecasts. She stresses the UK has collected air quality data since the 1960s, with the substances monitored expanding in line with the shifts in focus Prashant emphasises. And now, one scientist argues we need a further expansion.
Soaring into the unknown
Parisa Ariya, from McGill University in Montreal, Canada, says we should start specifically tracking nanometre-size particles in the air. She bases that both on measurements of the air and evidence from the snow that often falls near her lab. ‘Snow is a snapshot of atmospheric processes,’ she explains. The falling snow captures substances in the air, and so testing fresh snowfall with techniques including mass spectrometry provides an easy way to study the atmosphere.
DART lesson starter or settler exercise, ages 14–16
Reading comprehension is an important skill for pupils of all ages and DART (directed activities related to text) can help pupils build up stamina in dealing with introductory texts they will see in examination questions.
Download the exercise (MS Word or pdf) and the answers (MS Word or pdf).
Reading comprehension is an important skill for pupils of all ages and DART (directed activities related to text) can help pupils build up stamina in dealing with introductory texts they will see in examination questions. The DART activity downloadable from the Education in Chemistry website could provide a useful starter or settler activity.

The McGill team has found many different types of nanoparticle, some from natural sources. Others, however, were manmade materials, ranging from those that are usually fairly harmless, such as titanium oxide, to the toxic metal cadmium. She is especially worried about toxic nanoparticles from electronic waste that is supposedly sent for recycling, but which may not be.
We’re not yet certain about the health threat these nanoparticles pose, Parisa explains, but they’re likely to cause damage through chemical reactivity when they get into our systems. ‘Because little particles have a greater surface to volume ratio, that provides a huge possibility for different types of chemistry, lots of weird things happen,’ she says. ‘That’s actually one reason we use them as catalysts.’
We all have one planet, we have one environment – and the atmosphere allows pollution to become really international
Nanoparticles count as PM, because they’re smaller – by a factor of 1000 or more – than the micron-scale size limits used to define this pollution. Parisa points out that while there are more nanoparticles than larger particles, because they are so much smaller they account for less of the overall weight of PM. Yet current regulations aim to reduce the total concentration of pollutants, a measure that divides the weight emitted by the volume substances are spread over. They therefore prioritise eliminating larger particles. As such, nanoparticle emissions are effectively unregulated, she warns, although Canada, Europe and China have started talking about what to do.
Maths in science, differentiated, ages 14–16
These exercises immerse pupils in the mathematics of this measurement using familiar objects and a variety of pupil learning activities. They include a matching exercise, a reading exercise, a calculator conversion exercise and construction of a scale using toilet paper.
Download the resources here
The Canadian researchers featured in the article suggest nanometre-size particles in the air could be particularly problematic. Their large surface to volume ratio gives them greater potential to react in detrimental ways with our bodies when inhaled. Pupils really struggle to imagine just how small measurements in nanometres actually are. Exercises found on the Education in Chemistry website immerse pupils in the mathematics of this measurement using familiar objects and a variety of pupil learning activities. They include a matching exercise, a reading exercise, a calculator conversion exercise and construction of a scale using toilet paper. The exercises are differentiated to give greater to support to pupils with lower prior achievement. These activities could be used as a single lesson focusing on maths in science.
Many countries have largely dealt with problems caused by sulfur dioxide, and are getting to grips with NOx and PM, with more or less success. Now, to understand the nanoparticle problem and deal with it, international collaboration will be needed. That’s because nanoparticles’ size makes it easy for the wind to carry them long distances. ‘They can be transported across the sea and have a potential impact regionally and globally,’ Parisa says. And this underlines just how connected we all are, she adds. ‘We all have one planet, we have one environment – and the atmosphere allows pollution to become really international.’
Downloads available for this article:
- Specification lists (MS Word or pdf)
- Full article, without resources or notes (MS Word or pdf)
- All teaching ideas in a single file (MS Word or pdf)
- All the downloads in one zip file (MS Word or pdf)
- Combustion equations, foundation (MS Word or pdf)
- Combustion equations, higher (MS Word or pdf)
- Combustion equations, knowledge organiser (ppt or pdf)
- Combustion equations, teacher answer sheet (MS Word or pdf)
- Which is the best fuel, foundation (MS Word or pdf)
- Which is the best fuel, higher (MS Word or pdf)
- Which is the best fuel, teacher notes (MS Word or pdf)
- DART exercise (MS Word or pdf)
- DART exercise answers (MS Word or pdf)
Article by Andy Extance, a science writer based in Exeter, UK. Teaching resources by Kristy Turner, a school teacher fellow at the University of Manchester and Bolton School, UK
Downloads
Specification links
Word, Size 55.51 kbSpecification links
PDF, Size 50 kbFull article
Word, Size 60.67 kbFull article
PDF, Size 67.22 kbAll teaching ideas
Word, Size 56.5 kbAll teaching ideas
PDF, Size 72.64 kbAll downloads: MS Word
Zip, Size 0.63 mbAll downloads: pdf
Zip, Size 0.79 mbCombustion equations: foundation
Word, Size 53.59 kbCombustion equations: foundation
PDF, Size 48.43 kbCombustion equations: higher
Word, Size 53.75 kbCombustion equations: higher
PDF, Size 48.13 kbKnowledge organiser: three sources of pollution
PowerPoint, Size 85.42 kbKnowledge organiser: three sources of pollution
PDF, Size 0.12 mbCombustion equations: answers
Word, Size 54.01 kbCombustion equations: answers
PDF, Size 64.57 kbBest fuel experiment: foundation
Word, Size 56.26 kbBest fuel experiment: foundation
PDF, Size 76.92 kbBest fuel experiment: higher
Word, Size 91.46 kbBest fuel experiment: higher
PDF, Size 0.1 mbBest fuel experiment: teacher notes
Word, Size 56.86 kbBest fuel experiment: teacher notes
PDF, Size 0.14 mbDART exercise
Word, Size 53.82 kbDART exercise
PDF, Size 44.32 kbDART exercise: answers
Word, Size 54.61 kbDART exercise: answers
PDF, Size 45.07 kb


No comments yet