


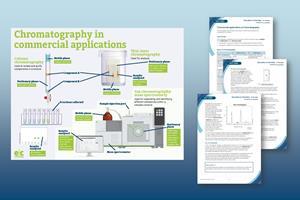
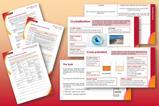
Link the analytical techniques you teach at post-16 to laboratory setups in industry
Chromatography is an analytical technique chemists use to separate the components of a mixture.
It separates the compounds in a mixture using their relative affinities for a mobile phase and a stationary phase. The greater a compound’s affinity for the mobile phase, the further it travels. The greater its affinity for the stationary phase, the shorter the distance it travels.
There are different types of chromatography, including paper chromatography, thin-layer chromatography (TLC), column chromatography, high-performance liquid chromatography (HPLC) and gas chromatography (GC).
-
-
TLC investigation
Develop practical skills using thin-layer chromatography within the familiar context of over-the-counter analgesics with this experiment from our Aspirin book collection.
View and download more infographics
Paper chromatography
The simplest type of chromatography, which chemists use to identify the dyes in mixtures such as ink or food colouring. The stationary phase is a sheet of chromatography paper and the mobile phase is a solvent, usually water, that soaks up through the paper by capillary action.
Thin-layer chromatography
Also known as TLC, scientists use it to quickly identify organic compounds present in a mixture.
Thin-layer chromatography’s stationary phase is a glass, metal or plastic sheet covered with a thin layer of either silica gel (silicon dioxide) or alumina (aluminium oxide). It is called a TLC plate
TLC’s mobile phase is an organic solvent or mixture of solvents that soaks up through the solid layer by capillary action
In TLC, we use the distance a substance moves compared to the mobile phase to identify the compound
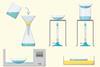
TLC starts with a baseline drawn in pencil on the TLC plate near to one end. The scientist dissolves the mixture they plan to analyse in a suitable solvent. They place a spot of this solution on the line. They then place the plate vertically in a tank containing just enough of the mobile phase to keep the liquid level below the baseline.
As the mobile phase moves up the TLC plate, the components in the mixture move different distances depending on how attracted they are to the stationary phase and how soluble they are in the mobile phase. You can vary the relative distances by changing the polarity of the mobile phase.
The components of an organic mixture are often colourless and not visible on the TLC plate, so scientists use specific visualisation techniques:
- Fluorescence – most TLC plates contain an additional substance which fluoresces in the visible region when placed in UV light. If the compound you’re analysing absorbs the UV light, it will not fluoresce and the substance shows up as a dark spot.
- Chemical stains – you can make compounds containing certain functional groups visible by reacting them with chemicals to produce a coloured compound. For example, amino acids and amines can be visualised using ninhydrin, which produces blue spots.
We call the distance a substance moves compared to the mobile phase its retention factor, or Rf value. If the stationary and mobile phases are known, we can use this to identify the compound by comparison to a database of known Rf values.
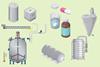
Column chromatography
We can use column chromatography to separate and isolate organic compounds from a mixture.
The stationary phase is silica gel, alumina or resin packed into a vertical glass tube – the column
Column chromatography’s mobile phase is an organic solvent or mixture of solvents that flows down the column under gravity
Chemists collect the fractions in test tubes as the liquid drips out the bottom of the column
In column chromatography, scientists use TLC to identify the compounds in each fraction
Scientists add the sample of the mixture to analyse to the top of the column and the components move through it at different speeds.
They can combine any fractions containing the same compound after they’ve collected them in test tubes and isolate the pure compound by gently evaporating off the mobile phase.
High-performance liquid chromatography
Also known as HPLC, we use this analytical technique to separate, identify and quantify soluble compounds in a mixture. The stationary phase is silica or resin packed inside a long narrow tube coiled within the machine. The mobile phase is water or a non-polar organic solvent that the machine pumps through the tube under pressure.
By forcing the mobile phase under high pressure through a coiled narrow column containing the stationary phase, chemists make the process much faster and it gives better separation due to the high surface area of the small solid particles. Scientists can use a variety of materials for the stationary phase, including ion-exchange resins that separate components based on their charge, size exclusion resins that separate components based on their size and chiral resins, which can separate optical isomers.
More resources
- Explore chromatography and its applications with our post-16 CPD article and resource. Task learners to research how chemists use other analytical techniques to identify a mixture’s components with the student sheet, teacher notes and answers.
- Watch practical videos on Paper chromatography and Thin-layer chromatography.
- Complete this project on the chemistry of food in a sequence of timetabled chemistry lessons, STEM clubs or during an activity day to provide context to TLC, titration and visible absorption spectroscopy.
- Read What analytical chemists do and share job profiles, such as Nicola’s as an assistant analyst. She used her understanding of chromatography during the London 2012 Olympic and Paralympic games. And watch Lewis’ video to see how he uses GC-MS to contribute to cutting-edge scientific research aiming to improve the diagnosis of diseases like cancer.
A detector identifies the compounds as they leave the column. The detector the chemists use depends on the properties of the compounds in the mixture. The output from the detector shows as a series of peaks.
We call the time a substance takes to pass through the column its retention time and we can compare with that of known compounds separated under the same conditions (mobile phase, stationary phase, pressure and temperature).
We can use the area under each peak to determine the relative quantities of compounds in a mixture, as long as they all respond similarly to the detector.
Gas chromatography
Chemists use gas chromatography (GC) to separate, identify and quantify volatile compounds present in trace amounts in a mixture. We can use the retention time to identify the compounds.
In GC, the stationary phase is a high boiling point liquid held on a finely divided inert solid inside a coiled tube. This tube can be as narrow as 0.1 mm wide and up to 100 m long. It sits within a variable temperature oven
GC's mobile phase is an inert gas, such as nitrogen or helium, that is pumped through the coiled tube
Scientists often connect gas chromatography columns to mass spectrometers. This combined technique is known as gas chromatography–mass spectrometry (GC–MS)
GC–MS allows us to immediately identify each compound as it leaves the column
Gas chromatography–mass spectrometry (GC–MS) has the advantage of being able to detect very small quantities of compounds. Its uses include detecting banned substances in urine samples from athletes, detecting traces of pesticide residues in food and in environmental monitoring to detect pollutants in the air, soil or water.
Did you know …?
The International Space Station uses miniaturised gas chromatography–mass spectrometry devices to monitor the atmosphere. They are just 25 × 25 × 20 cm and have a mass less than 9.5 kg.
Downloads
Solvent vapour
PDF, Size 0.61 mbCommercial applications of chromatography fact sheet
Handout | PDF, Size 0.17 mbThin-layer chromatography and analgesics student sheet
Handout | PDF, Size 0.28 mbThin-layer chromatography and analgesics teacher notes
Handout | PDF, Size 0.24 mbCommercial applications of chromatography fact sheet
Editable handout | Word, Size 0.5 mbThin-layer chromatography and analgesics student sheet
Editable handout | Word, Size 0.56 mbThin-layer chromatography and analgesics teacher notes
Editable handout | Word, Size 0.52 mb


1 Reader's comment