


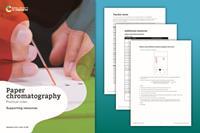
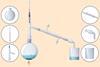
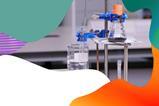
Investigate the separation of inks using paper chromatography
The value of experiencing live practical work cannot be overstated. Numerous studies provide evidence of its value in terms of learner engagement, understanding, results and the likelihood of continuing to study chemistry or work in a related field.
Use this video to complement live practical work, or to help learners understand the methods, equipment and skills when they cannot access the lab.
Chapter titles: 00:10 Introduction to chromatography; 00:44 Carrying out the experiment; 03:59 Results; 04:43 Animation; 05:11 Alternative phases; 06:05 Calculating Rf values.
Teacher notes
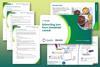
Full teacher notes are available in the supporting resources booklet (also available in MS Word), including ideas for how to use this video and the accompanying activites and answers to use as part of your teaching.
-
-
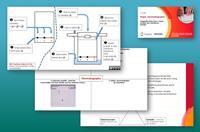
Learner slides
Integrated instructions, Frayer models and Johnstone's triangle
Download as: MS PowerPoint -
Notes on running the practical experiments
This experiment is designed to cover most of the questions asked in a variety of syllabuses. You or your school’s technician will have to do some trial and error to get the ink composition correct to get the desired results. The suggestion is that one ink is not soluble in the water (solvent) and so doesn’t move, one colour moves to the top of the paper (learners can identify this as the most soluble) and there is a colour in common between two of the samples. Although the video and worksheets refer to particular colours seen in the video, the actual colours don’t matter and it is their characteristics that are key to the success of the practical.
Use the video’s animation and Johnstone’s triangle, available in the PowerPoint slides, to help learners link their observations to what’s going on at the submicroscopic level.
Health, safety and technical notes
You may want to demonstrate the experiment using a different solvent, such as ethanol (CLEAPSS student safety sheet 60). Use a lid and wear eye protection (safety glasses to EN166 F) when using the alcohol. To show a different stationary phase, use a TLC plate.
Read our standard health and safety guidance and carry out a risk assessment before running any live practical. Refer to SSERC/CLEAPSS Hazcards, recipe books and student safety sheets. Hazard classification may vary depending on supplier. Download the technician notes for the full equipment list, safety notes and tips.
Procedure
- Cut a piece of filter paper to fit inside a beaker (size of the beaker is not relevant) so that it does not curve and lies flat, not touching the edges of the beaker.
- Using a pencil, draw an origin line on the paper and label 1, 2 and 3 at equal distances below the line.
- Using a separate capillary tube for each ink, transfer a small spot onto the correct labelled position on the origin line.
- Add a small amount of the solvent to just cover the bottom of the beaker.
- Check the paper is the right length by lining it up on the outside of the beaker so that the water is below the origin line. Roll the paper round a splint and hold it with a paper clip.
- Place the paper inside the beaker. Make sure it just touches the water and it is vertical.
- Remove the filter paper from the beaker when the solvent has nearly reached the top of the filter paper.
- Leave the filter paper to dry or use a hairdryer.
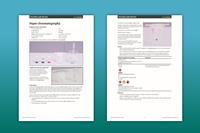
- Measure the distances from the origin line to the middle of the colours and from the origin line to the solvent front to find the Rf values.
Find the integrated instructions for this experiment in the PowerPoint slides.
Real-world contexts
- Highlight everyday uses of chromatography with the article Poisoned by milk.
- Complete this project on the chemistry of food in a sequence of timetabled chemistry lessons, STEM clubs or during an activity day to provide context to analytical techniques.
- Engage younger learners with this investigation to solve who stole a famous painting.
- Watch this video to see how senior science manager Paul uses liquid chromatography in his job at British Sugar.
Key terms
Learners will need to have a clear understanding of the following scientific terminology:
- Chromatography – a technique for separating mixtures of soluble substances.
- Chromatogram – the results of separating mixtures by chromatography.
- Mixture – two or more different substances, not chemically joined together.
- Solvent – the substance a solute dissolves in to form a solution.
- Solute – a substance that will dissolve in a solvent.
- Dissolve – when a solute mixes completely with a solvent to produce a solution.
- Solution – a mixture formed by a solute and a solvent.
- Soluble – a substance that will dissolve.
- Insoluble – a substance that will not dissolve.
- Pure – a substance made of only one element or compound.
- Impure – a substance made of more than one element or compound.
- Rf value – the ratio of the solute’s distance travelled to the solvent’s distance travelled.
- Stationary phase – the substance that does not move, eg paper.
- Mobile phase – the solvent that moves up the stationary phase, eg water.
- Origin line – the mark you add the samples to at the start of chromatography.
- Solvent front – the distance travelled by the solvent.
- Volatile – evaporates easily.
You will find a template, example Frayer model and suggested answers for the terms: ‘chromatography’, ‘mobile phase’, ‘stationary phase’, ‘origin line’ and ‘solvent front’ in the PowerPoint slides. Find more examples and tips on how to use Frayer models in your teaching.
Cross-curriculum links and skills
Learners will use key maths skills in the practical including:
- Measuring distances accurately.
- Ratios.
- Giving answers to a specified decimal place.
Common misconceptions
Using pen to draw the origin line. Bring attention to using pencil and encourage learners to think why pens might interfere with the separation.
Putting too much solvent so learners submerge the origin line. Ensure the solvent is below the origin line and learners understand why.
Allowing the solvent to travel too far up the paper. The solvent front will be lost meaning the Rf value cannot be calculated.
All mixtures are separated using only one separating technique. Practise a range of techniques with learners and highlight that chromatography is a method of separation for analysing a mixture but does not achieve separation of the entire test mixture. Carry out further methods once purity has been determined and/or the impurities identified.
The solvent/mobile phase can only be water. Use different solvents, such as sodium chloride solution and ethanol.
The stationary phase in chromatography can only be paper. Introduce alternatives, such as thin layer chromatography using silica on a plastic backing or aluminium oxide coated plates.
Dyes have a preference or ‘like’ to be in the stationary or the mobile phase. Avoid anthropomorphising as analogies like this can be a barrier to deep learning. Use ‘is attracted to’ or ‘hydrophobic/philic’ instead.
More resources
- Do this chromatography practical using dye from different coloured sweets with your 11–16 year-old learners and read the accompanying article to find out more about baking with sprinkles.
- Make cross-curricular links to biology and investigate the pigments in a leaf.
- Practical planning: spot the mistakes includes an exam-style answer on chromatography and is part of the Teaching science skills series.
Downloads
Paper chromatography supporting resources
Handout | PDF, Size 0.58 mbPaper chromatography technician notes
Handout | PDF, Size 0.42 mbPaper chromatography slides
Editable handout | PowerPoint, Size 0.55 mbPaper chromatography supporting resources
Editable handout | Word, Size 0.58 mb
Additional information
The original video script, supporting resources and slides were written by Karen Marshall. The technician notes were adapted by Sandrine Bouchelkia.
- Prepare(1)
- Deliver(1)
 Poster
Teaching distillation’s apparatus and stages
Walk your 14–16 learners through the process of distillation and the equipment needed
- Literacy(2)
 Resource
Elements, compounds and mixtures | Reading comprehension | 14–16
Practise reading comprehension skills with a science research article about a new technique for extracting lithium
 Resource
Elements, compounds and mixtures | Key terms support | 14–16
Key terms list, accessible glossary, Frayer models and unscrambling definitions provide comprehensive language support for this topic
- Assess(4)
 Resource
Chromatography | Knowledge check | 14–16
Assess learning of paper chromatography with a higher and foundation worksheet
 Resource
Chromatography and developing vaccines | In context | 14–16
Put chromatography into context with questions based on vaccine development
 Resource
Chromatography | Review my learning worksheets | 14–16 years
Identify learning gaps and misconceptions with this set of worksheets offering three levels of support
 Resource
Practical planning: spot the mistakes | 14–16 years
Use these exam-style questions to check your learners’ understanding of experimental skills and strategies
- Enrich(3)
 Class experiment
Leaf chromatography
Investigate leaves using paper chromatography with this classroom experiment and follow-up questions
currently reading
 Practical video
Paper chromatography | practical videos | 14–16 years
Video and resources showing how to separate colours in inks using paper chromatography
 Project
Analysing the chemistry of food | Chemistry for All project | 14–16 years
Analyse food and drink samples using TLC, titration and visible absorption spectroscopy with this engaging project


Practical videos | 14–16 years
Videos of core practical experiments for flipped learning, remote teaching or revision
- 1
 Currently
reading
Currently
reading
Paper chromatography
- 3
- 4
- 5
- 6
- 7
- 8
- 9
- 10
- 11
- 12
- 13
- 14


No comments yet