


Compare the sugar content and pH of a range of fizzy drinks
This session should take approximately one hour to complete in full. It was initially created for 11–14 year-old learners but can be adapted for other age groups.
Use in a sequence of timetabled lessons, science clubs or as part of an activity day.
Learning objectives
- Compare the sugar content and pH of a range of fizzy drinks.
- Discuss the health implications of sugar and acidity.

This resource was developed as part of the Chemistry for All project. The project was set up to explore and address barriers to participation in UK chemistry undergraduate study through a longitudinal project. Read the findings relevant to teachers, outreach providers, education policymakers and parents in the summary report, or download the full research report.
Guidance notes
Activity 1: cola and milk
In Activity 1, learners will make observations about the change in the appearance of cola over time following the addition of whole milk.
Use this video of the experiment and expected observations from Home Science channel, (slide 4). Ask learners to record their observations in the table included in their workbook and answer the questions. Alternatively, you could demonstrate this reaction and remind learners to observe the bottle’s contents throughout the lesson. If you have the time and sufficient resources, learners could do this activity themselves.
Activity 2: pH of soft drinks
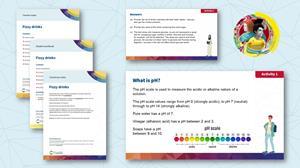
Learners can then work in groups of three or four to encourage discussion while they investigate how acidic soft drinks can be. The method is in the student workbook. Slide 8 of the PowerPoint provides a pH scale for learners to use to interpret colour changes with universal indicator. Once learners have collected their results table, they should use their observations to answer the questions in their student workbooks.
Demonstration: sugar in soft drinks
Compare the sugar in Coca-Cola® and its zero sugar version by heating two samples. Set this up in front of learners, then return to it once the drinks have evaporated. Discuss what is happening and why during the demonstration as the liquid evaporates.
Encourage learners to think about why the amount of sugar in the drinks could be an issue and how it may cause harm to our health. They should use their observations to answer the questions.
Activity 3: sugar or no sugar?
Learners will then use glucose test strips and the sugar scale on slide 14 to identify the sugar and zero versions of each soft drink. Explain that the test is based on the enzymatic reaction that occurs between glucose oxidase, peroxidase and chromogen. Glucose is first oxidised to produce gluconic acid and hydrogen peroxide in the presence of glucose oxidase. The hydrogen peroxide reacts with potassium iodide chromogen in the presence of peroxidase. The extent to which the chromogen is oxidised determines the colour produced.
Plenary
As a plenary, ask learners to think about the potential health issues of sugary drinks. Discuss the importance of good dental hygiene and teeth brushing before showing the pH values of more fizzy drinks and challenging them to identify which drinks could cause their teeth to dissolve if they drank too much of them.
Find all the answers in the teacher notes and on the slides.
Health and safety
Read our health and safety guidance and carry out a risk assessment before running any live practical.
Find specific safety advice for the chemicals used in this project in the technician notes. The safety equipment suggested is in line with CLEAPSS requirements. For non-hazardous substances, wearing lab coats can help to protect clothes. The safety rules might be different where you live so it is worth checking local and school guidance.
More resources
- Analyse data to learn how food scientists determine the viscosity of ice cream and how it varies with fat content.
- Investigate the density and mass of sugar dissolved in fizzy drinks with 9–11 year-old learners. The instructions are available in English and Welsh.
- Watch the video and download the Edible experiments: sugar rush demo sheet to help you present and explain the chemistry.
- Discover why pressurised drinks froth and foam when you open them using this problem-solving In search of more solutions activity.
Careers
The Chemistry for All project found that recognising the value and importance of chemistry, and appreciating how chemistry can lead to interesting and well-paid jobs strongly related to learners’ future aspirations. Discover how chemistry can prepare learners to pursue apprenticeships, university courses and vocational routes, or browse job profiles and try our career options game from A Future in Chemistry.
Between Activities 2 and 3, introduce learners to Paul, a senior science manager. He works for British Sugar and manages the scientific services, developing and implementing process improvements. Watch his video job profile, available on slide 10 of the PowerPoint, to show your learners how chemistry careers are making a difference.
Find more activities like this, plus longer projects suitable for off-timetable days, science lessons or clubs on our Outreach resources hub.
Downloads
Fizzy drinks student workbook
Editable handout | Word, Size 0.47 mbFizzy drinks student workbook
Handout | PDF, Size 0.51 mbFizzy drinks teacher notes
Editable handout | Word, Size 0.48 mbFizzy drinks teacher notes
Handout | PDF, Size 0.5 mbFizzy drinks technician notes
Editable handout | Word, Size 0.47 mbFizzy drinks technician notes
Handout | PDF, Size 0.41 mbFizzy drinks presentation slides
Presentation | PowerPoint, Size 2.19 mbFizzy drinks presentation slides
Presentation | PDF, Size 1.06 mb
Additional information
This resource was originally developed by the University of Reading to support outreach work delivered as part of the Chemistry for All project.


No comments yet