


Learners identify the weak acid and conjugate base in an acid–base equilibrium reaction; explain why a particular indicator changes colour and sketch pH curves for acid–base titrations to identify the best indicator to use during a titration
This resource accompanies the Education in Chemistry article Acids in our oceans.
Learning objectives
- To understand that indicators are weak acids in which the colour of the aqueous solution of the acid is distinctly different from that of its conjugate base.
- To know that the pH range over which a colour change occurs can be estimated by pH = -pKIn ± 1.
- To be able to sketch the pH curves for different acid–base titrations and suggest suitable indicators based on data given.
Questions
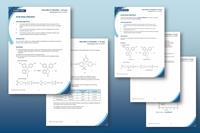
There are three questions on the student worksheet. Learners need to be able to identify the weak acid and conjugate base in an acid–base equilibrium reaction; explain why a particular indicator changes colour and sketch pH curves for acid–base titrations. Learners will demonstrate that they can identify the best indicator to use during a titration based on the pH range and circle the proton released during dissociation of a weak acid on a structural equation.
The indicators in the resource include phenolphthalein, methyl-orange, phenol red and 4-nitrophenol.
-

Link to careers
Meet Ben Fisher, a marine biogeochemist at the University of Edinburgh. Watch the video job profile where he explains his PhD, which focuses on how the oceans are responding to climate change.
More resources
- Add ocean acidification to your existing lessons at 14–16 with this article and resources from the Sustainability in chemistry series.
- For more contexts as well as ideas and activities for discussing pH and indicators read Teaching acids and bases post-16.
- The worksheets in this acids and bases resource provide further practise on acid-base equilibria.
- Find more job profiles on A Future in Chemistry.
Downloads
Acid-base indicators | Student worksheet
Handout | PDF, Size 0.29 mbAcid-base indicators | Teacher notes
Handout | PDF, Size 0.33 mbAcid-base indicators | Student worksheet
Editable handout | Word, Size 0.56 mbAcid-base indicators | Teacher notes
Editable handout | Word, Size 0.54 mb


2 readers' comments