


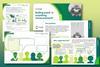
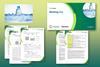
A diagnostic exercise, practical and worksheet to assess and boost students’ grasp of graphing
Chemistry teachers know that graphical representations are essential in their subject and that conceiving abstract graphs as mathematical objects is necessary to manipulate chemical graphs and laws. So, it goes without saying that chemistry students need to master this area of study. Novice chemists often perceive graphs as pictures and representations, rather than mathematical objects they can manipulate. Expert chemists, on the other hand, know how to navigate between the universal and the particular.
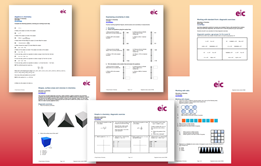
Use this diagnostic exercise to assess students’ grasp of graphing, relate these ideas to simple chemical laws and decide whether more class time should be devoted to these particular skills.
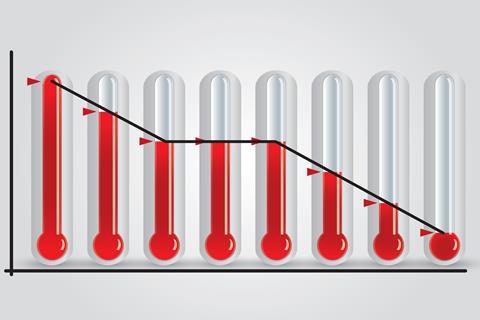
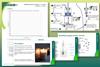
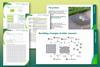
Also use the data from a cooling curves practical to complete various graph-drawing exercises. Heating and cooling curves can be drawn at different levels of abstraction: the representative graph of a particular experiment, the universal graph for the substance being analysed, and an even more abstract ‘generic’ curve showing the overall pattern. The worksheet takes students through the levels to consider the role of different graphs.
Use this resource alongside the Education in Chemistry article How to approach graphs in chemistry.
Downloads
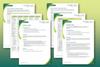
Graphs in Chemistry_ Diagnostic exercise
Editable handout | Word, Size 74.12 kbGraphs in Chemistry_ Diagnostic exercise
Editable handout | PDF, Size 90.84 kbGraphs in Chemistry_ Cooling curves
Editable handout | Word, Size 0.14 mbGraphs in Chemistry_ Cooling curves
Editable handout | PDF, Size 77.82 kb
- Prepare(3)
 Resource
Students’ ideas about changes of state | Beyond appearances
Changes in state need changes in thinking to be understood, explore how to support learners to develop a new way of seeing state changes
currently reading
 Resource
Improve graph skills for chemistry
A diagnostic exercise, practical and worksheet to assess and boost students’ grasp of graphing
 Course
Particle and atomic models | Self-led course
Strengthen your subject knowledge and discover teaching strategies to develop your learners’ understanding of the particle model and atomic structure
- Deliver(8)
 Class experiment
Supercooling and the energetics of freezing
Explore what happens when a liquid is supercooled and develop learners’ observation skills in this class practical
 Lesson plan
What happens when a substance changes state? | Lesson plan | 11–14 years
Use this lesson plan, complete with scaffolded and unscaffolded student sheets, to secure learners’ understanding of changes of state
 Class experiment
Melting and freezing stearic acid
In this class practical students take the temperature of stearic acid at regular intervals as they heat and cool it. Includes kit list and safety instructions.
 Resource
Melting and boiling | Johnstone’s triangle worksheets | 11–14 years
Develop learners’ understanding of melting and boiling with this worksheet, including a teacher demonstration for learners to observe
 Resource
Melting and boiling points | Developing understanding | 11–14 years
Deepen understanding of melting and boiling points and how these are represented at different conceptual levels of thinking
 Resource
Changes of state | Structure strip | 11–14 years
Use scaffolded prompts to support learners to write about changes of state
 Poster
Evaporation in action
Boost your 11–14 students’ knowledge and understanding of separation techniques with this poster, fact sheet and practical activity
 Poster
The science of melting chocolate
Use this infographic with your 11–14 students to develop their knowledge of changes of state and their graphing skills
- Literacy(3)
 Resource
Particle model | Key terms support | 11–14
Language support pack for particle model, with key terms list, accessible glossary, Frayer models and unscrambling definitions
 Resource
Particle model | Reading comprehension | 11–14 years
Use this reading comprehension based on a real science research news story to develop literacy skills and confidence
 Resource
Particle model | Structured talk | 11–14 years
In this speaking and listening task learners work together to build word bridges, building and sharing understanding by applying the particle model
- Enrich(6)
 Extension
Boiling point: a surprising measurement | Stretch and challenge | 11–14 years
Develop critical thinking skills by guiding learners to evaluate possible explanations for an unexpected experimental result
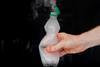 Exhibition chemistry
Forming a cloud in a bottle
Explore evaporation, condensation and equilibrium with this quick and easy demonstration
 Class experiment
Rate of evaporation
Use this class practical to measure and compare the rate of evaporation of propanone under different conditions
 Exhibition chemistry
Boiling without heating
Overcome common misconceptions about changes of state and vaporisation with water, a syringe and reduced pressure
 Resource
Salt (for cooking) activities | 11–14 years
Uncover the properties and health implications of salt in our diets
 Resource
Making ice | In Search of More Solutions | 11–14 years
Explore the properties of water and ice in this planning activity
Maths skills for chemistry
Resources to help your students apply their maths knowledge in their chemistry lessons
- 1
- 2
- 3
- 4
- 5
- 6
 Currently
reading
Currently
reading
Improve graph skills for chemistry


1 Reader's comment