


Quiz your students on their analysis knowledge
The topics covered in this Starter for ten activity are: the mass spectrometer, isotopic abundance, molecular mass spectroscopy and infra-red spectroscopy.
Example questions
The diagram below shows a simple mass spectrometer. Name the processes that occur at each of the points 1 - 5 highlighted;
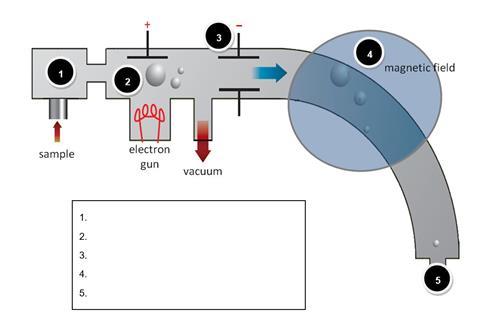
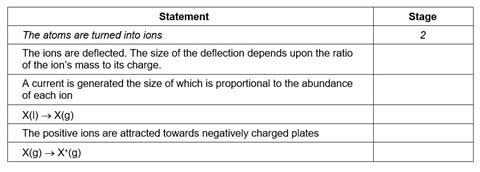
For each of the statements below, indicate with the appropriate number, the stage in the mass spectrometer at which that process occurs. The first one has been done for you.
The ratio of the different isotopes of certain elements can be used to identify objects from outer space. By comparing the isotope patterns with samples known to originate on earth the scientists can determine the origins of unknown objects.
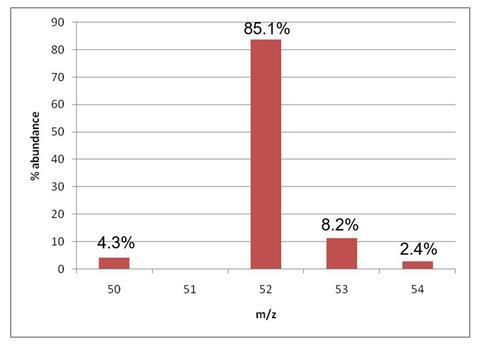
The mass spectrum opposite is of a sample of chromium extracted from a rock recently found in the Nevada desert. Scientists believe it may be from a meteor.
Use the mass spectrum to determine the relative atomic mass of the chromium in the rock. Based on your result, make a recommendation as to the origin of the rock sample.
The data below gives the m/z ratio and relative abundance of different isotopes of an element X. Determine the relative atomic mass of the element X to 1 d.p.
Suggest an identity for X.
The element magnesium (relative atomic mass 24.3) has three naturally occurring isotopes, 24.0Mg, 25.0Mg and 26.0Mg. If the percentage of the heaviest isotope is 11.0%, what is the percentage of the lightest isotope present?
Notes
The full version of this question and answer sheet is available from the ‘Downloads’ section below. An editable version is also available.
Starters for 10: Advanced level 1 (16–18)

This chapter in our Starters for ten series covers quantitative chemistry, atomic structure, bonding, trends in the periodic table, organic chemistry, thermodynamics, kinetics, equilibria, redox, analysis and experimental skills.
- 1
- 2
- 3
- 4
- 5
- 6
- 7
- 8
- 9
- 10
 Currently
reading
Currently
reading
Analysis
- 12


1 Reader's comment