











Everything you need to support learners to develop their skills interpreting graphs and data in a chemistry context
This flexible set of resources supports you to build confidence and capability for all your learners in this key area of maths for chemistry.
Download the resources below, and see our guidance on how to use them.
-
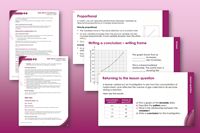
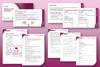
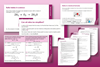
Teacher-led presentation
A carefully structured lesson to build skills and model their application to chemistry
-
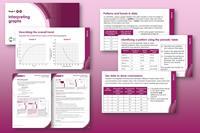
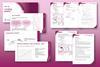
Short activities
A set of quick activities to engage and embed skills, use as lesson starters or for recap
-
Explore the full series Maths skills for chemistry
Introduction
This pack of resources builds on what students have learnt about graphs and data in maths and supports them to apply that in their chemistry lessons. A separate resources pack is available to build skills in creating graphs in chemistry.
These graphs skills resources are part of a series that covers mathematical skills which are fundamental to chemistry teaching. Other topics in the series:
- Ratio and proportion
- Understanding number, divided into:
- Unit conversion
- Significant figures and rounding
- Algebra and equations
Support for the language of mathematics
Key mathematical vocabulary for each skill area is defined in the key terms support. Find the key terms listed by topic area and an accessible glossary slide for each term.
Learning objectives
Stage 1
- Describe and compare patterns and trends in data.
- Understand how the variables are related to each other.
- Use data to draw conclusions about chemical reactions.
Stage 2
- Interpret graphs to describe the relationship between data.
- Describe the trend on rates of reaction graphs.
- Explain the trend on rates of reaction graphs.
How to use the resources
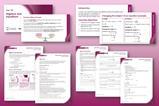
Teacher-led presentation
This is a full lesson focused on mastering maths skills in a chemistry context. The aim is for learners to develop key skills and then begin to apply these independently.
As you move through the presentation, there is a clear progression in skill development. The first slides engage learners’ prior knowledge of the chosen maths skills. These slides link back to their learning from maths lessons as well as prior chemistry knowledge, where applicable.
Following this, the slides move onto some maths−chemistry translation tasks, then learners complete activities within a chemistry context.
The teacher-led presentation is designed to be used:
- prior to teaching a topic which makes explicit use of the maths skill, such as describing patterns and trends in results, identifying information from multiple data sets and writing conclusions from graphs
- after summative assessment as an intervention.
Extensive guidance is offered for each slide so that you can model mathematics and translate between maths and science contexts with confidence.
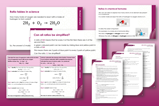
Short activities
The aim of the short activities is for learners to revisit and practise skills from the teacher-led presentation and to develop problem solving skills so they can apply these independently.
As you move through the activities, there is a clear progression in skill development. The first activity or activities engage learners’ prior knowledge of the chosen maths skill. Following this, learners will complete activities within a chemistry context.
Activities can be teacher-led, for learners requiring additional support or modelling, or can be set as independent work.
Each presentation contains a set of short activities that are designed to last 5–15 minutes and to be used as:
- a starter activity to engage prior knowledge or to practise a skill
- an assessment tool, used at the beginning of a lesson or sequence of work
- follow-up independent practice during lessons or plenary
- retrieval practice.
Teacher notes offer support and guidance for each activity.
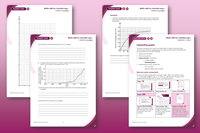
Learner worksheet
The learner worksheets help students to develop and apply maths skills independently. They complement the teacher-led presentations but can function independently, for example as a classroom activity or homework assignment.
Use the learner worksheets for:
- Reviewing learning – if learners are confident with the mathematical skill, use the worksheets as a tool to review learning and assess learners’ skill level.
- Independent practice – provide learners with the worksheets to use as independent practice.
- Scaffolded practice – break the worksheet into sections and complete over a longer period, such as multiple lessons.
- Mathematical modelling – for those requiring additional support, talk through the initial questions pulling out the mathematical skills used to answer the question, highlighting and defining any key terms. If learners are still finding the task difficult, consider fading the initial questions and asking learners to complete the later questions independently.
Scaffolding
Like all of the resources in this set, the worksheets present a clear progression in skill development. Each one starts with a recap of key knowledge and a worked example. The first question engages prior knowledge of the chosen maths skill. Following this, learners will do some maths–chemistry translation tasks, then complete questions in a chemistry context.
Downloads
Teacher presentation interpreting graphs stage 1 slides
Handout | PDF, Size 1.61 mbTeacher presentation interpreting graphs stage 1 teacher notes
Handout | PDF, Size 0.64 mbShort activities interpreting graphs stage 1 slides
Handout | PDF, Size 2.6 mbShort activities interpreting graphs stage 1 teacher notes
Handout | PDF, Size 0.67 mbWorksheet interpreting graphs stage 1 student sheet
Handout | PDF, Size 0.25 mbWorksheet interpreting graphs stage 1 teacher notes
Handout | PDF, Size 0.54 mbTeacher presentation interpreting graphs stage 1 slides
Presentation | PowerPoint, Size 2.37 mbTeacher presentation interpreting graphs stage 1 teacher notes
Editable handout | Word, Size 0.32 mbShort activities interpreting graphs stage 1 slides
Presentation | PowerPoint, Size 2.08 mbShort activities interpreting graphs stage 1 teacher notes
Editable handout | Word, Size 0.31 mbWorksheet interpreting graphs stage 1 student sheet
Editable handout | Word, Size 0.19 mbWorksheet interpreting graphs stage 1 teacher notes
Editable handout | Word, Size 0.28 mbTeacher presentation interpreting graphs stage 2 slides
Handout | PDF, Size 0.91 mbTeacher presentation interpreting graphs stage 2 teacher notes
Handout | PDF, Size 0.49 mbShort activities interpreting graphs stage 2 slides
Handout | PDF, Size 0.58 mbShort activities interpreting graphs stage 2 teacher notes
Handout | PDF, Size 0.45 mbWorksheet interpreting graphs stage 2 student sheet
Handout | PDF, Size 0.16 mbWorksheet interpreting graphs stage 2 teacher notes
Handout | PDF, Size 0.52 mbTeacher presentation interpreting graphs stage 2 slides
Presentation | PowerPoint, Size 2.01 mbTeacher presentation interpreting graphs stage 2 teacher notes
Editable handout | Word, Size 0.24 mbShort activities interpreting graphs stage 2 slides
Presentation | PowerPoint, Size 1.83 mbShort activities interpreting graphs stage 2 teacher notes
Editable handout | Word, Size 0.23 mbWorksheet interpreting graphs stage 2 student sheet
Editable handout | Word, Size 0.15 mbWorksheet interpreting graphs stage 2 teacher notes
Editable handout | Word, Size 0.26 mb




No comments yet